Aller au contenu
Finance · Stats caisse
Analyse my till sales

Till statistics show your restaurant over a period: services, hours, order sources, servers, discounts, customers and kitchen. You also set sales targets for the team there.

  • Computer
  • 5 steps
  • Level : Intermediate
Analyse my till sales : Till statistics

Who is it for?

  • Patron / gérant
  • Directeur
  • Responsable de salle
  • Responsable multi-sites

Roles with access

  • Gérant·e
  • Siège (réseau) · view
  • Boutique (réseau)
  • Franchisé·e (réseau)
  • Directeur·rice d'établissement
  • Responsable commercial · view
  • Responsable siège · view
  • Comptable · view

The owner always has access. See what each role sees →

Recommended hardware

Computer

A computer or a tablet: the tables and the hours heat map are wide.

See the hardware →

What it is for

  • See when you sell most: by service, by hour and by day of the week.
  • Compare order sources, payment methods and servers.
  • Set a sales target (“20 desserts this week”) and follow the team ranking.

Why set it up

  • A sale is a paid bill: training mode is never counted.
  • Turnover is net of credit notes.
  • A figure that cannot be computed shows “—” with its reason, never zero.

The same screen, on every device

The real software screens, as they appear on each device.

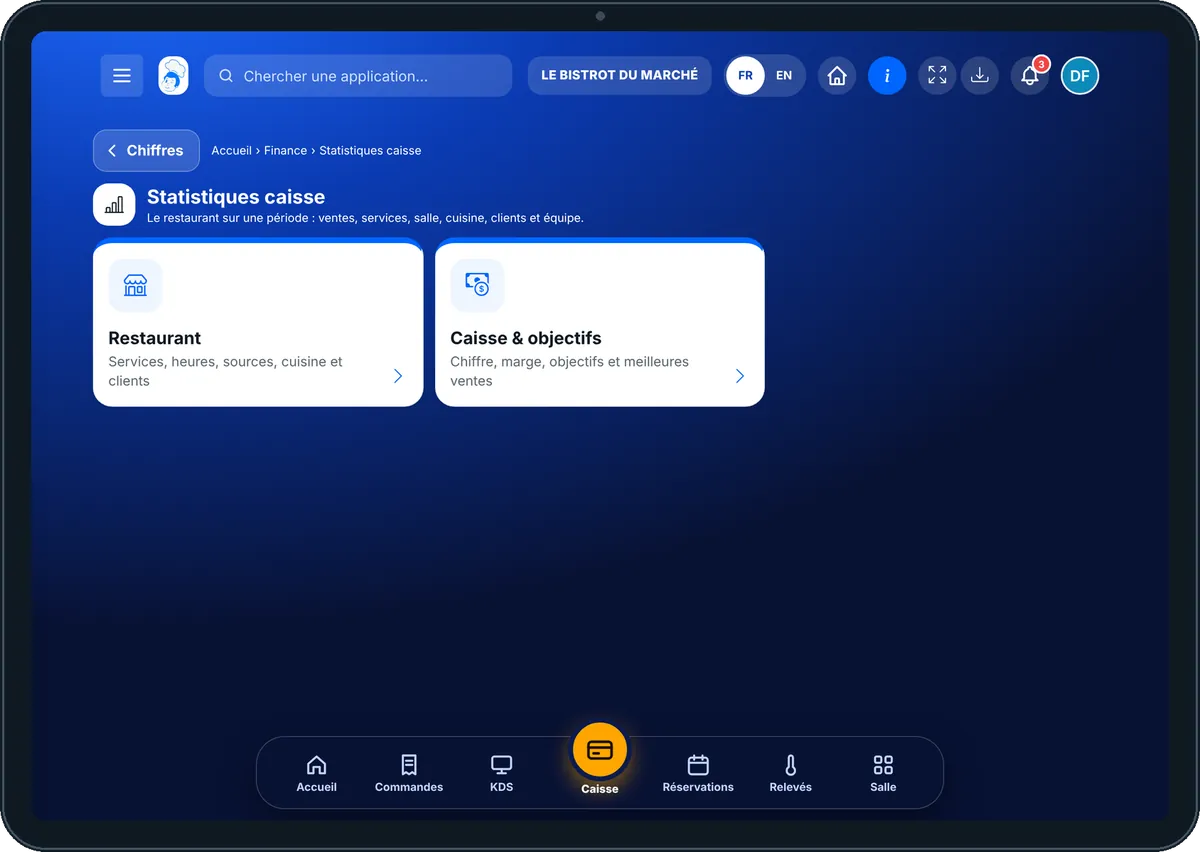
Stats caisse — On the tablet
On the tablet
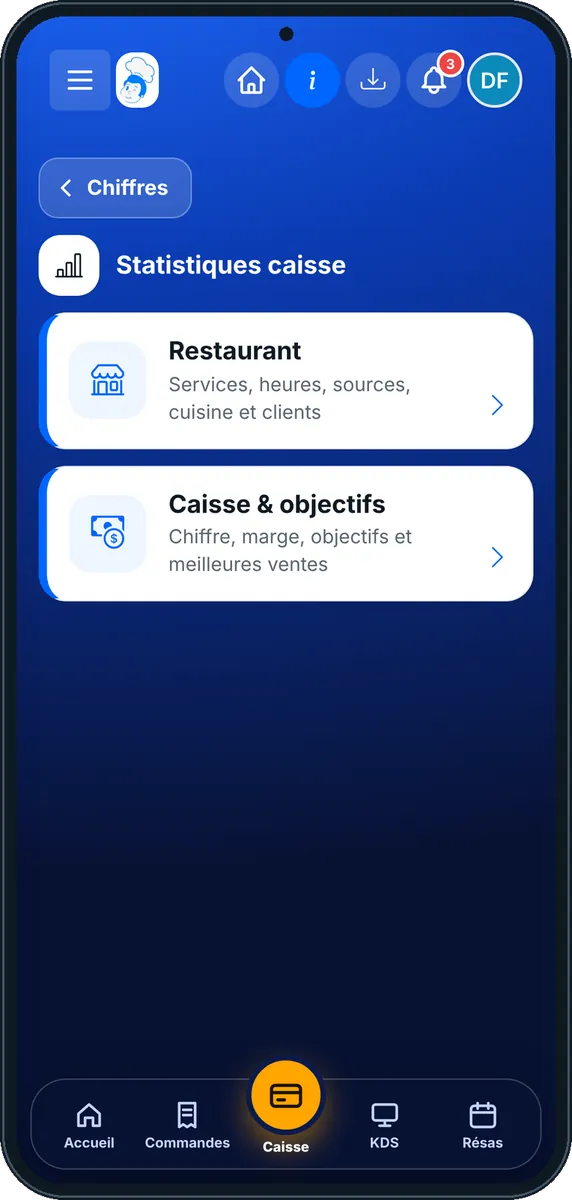
Stats caisse — On the phone
On the phone
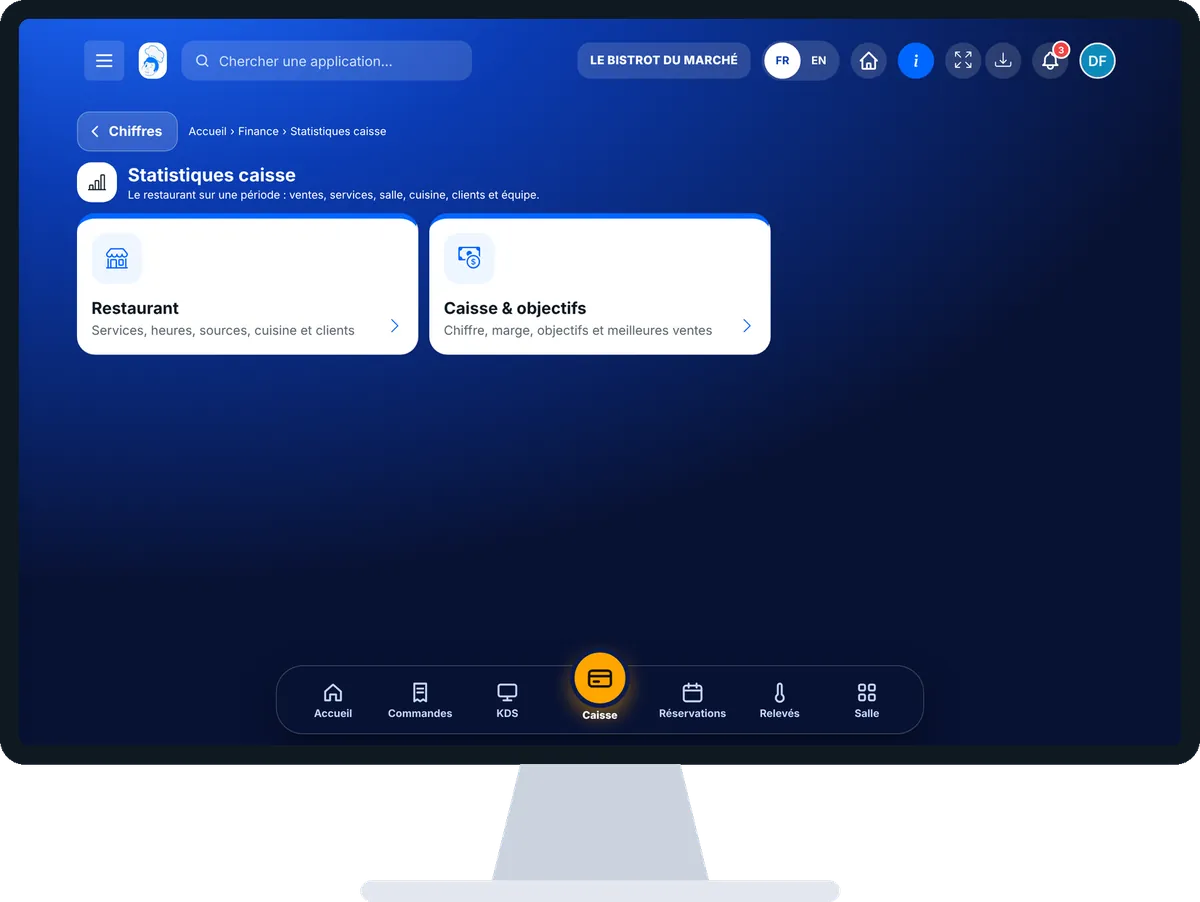
Stats caisse — On the computer
On the computer

Step by step

Analyse my till sales : 5 steps, with the real software screens.

  1. 1Step 1

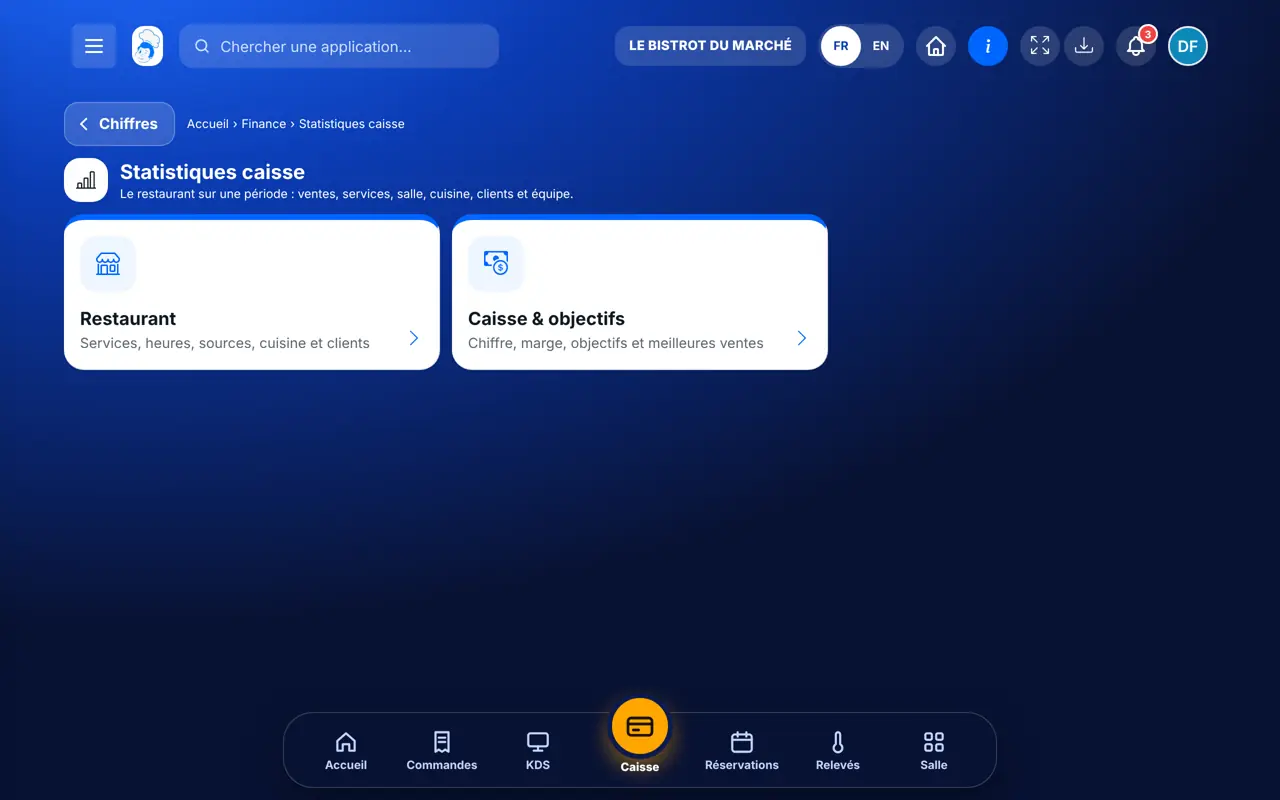
    Open the statistics

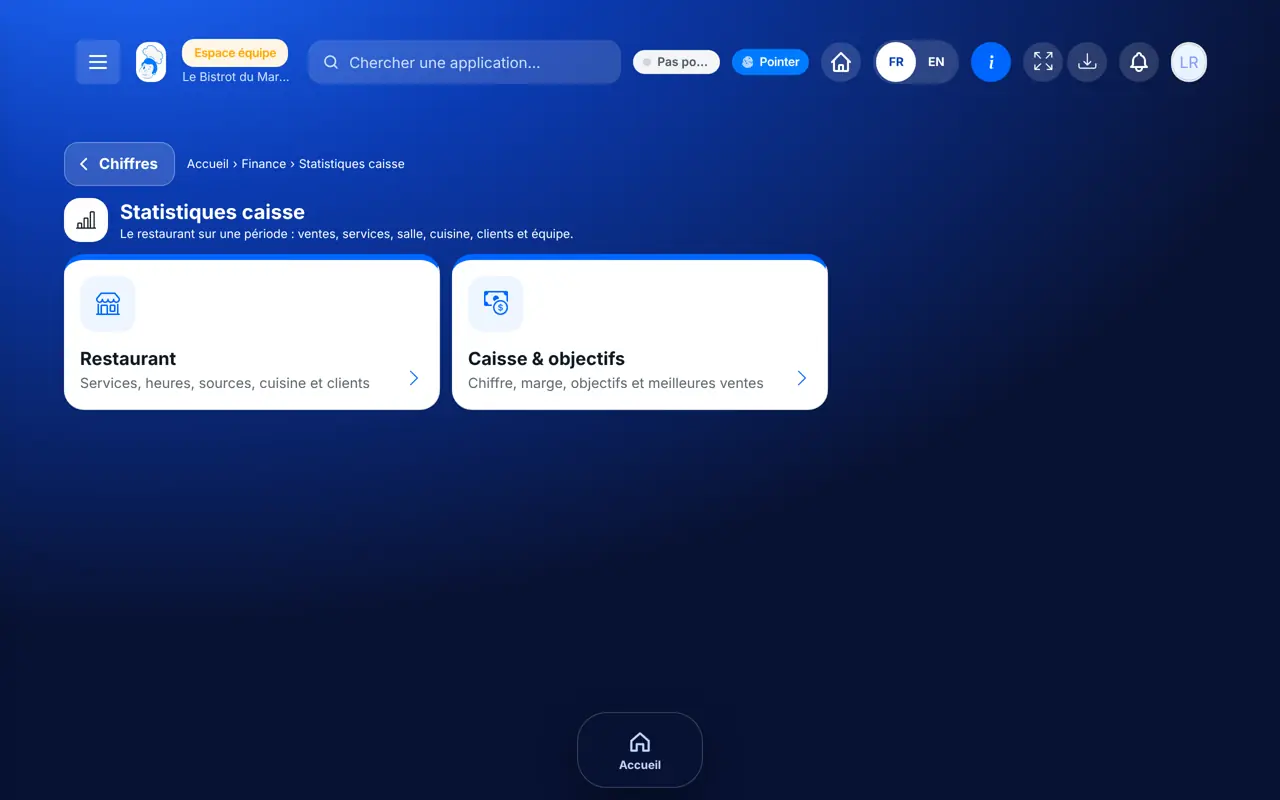
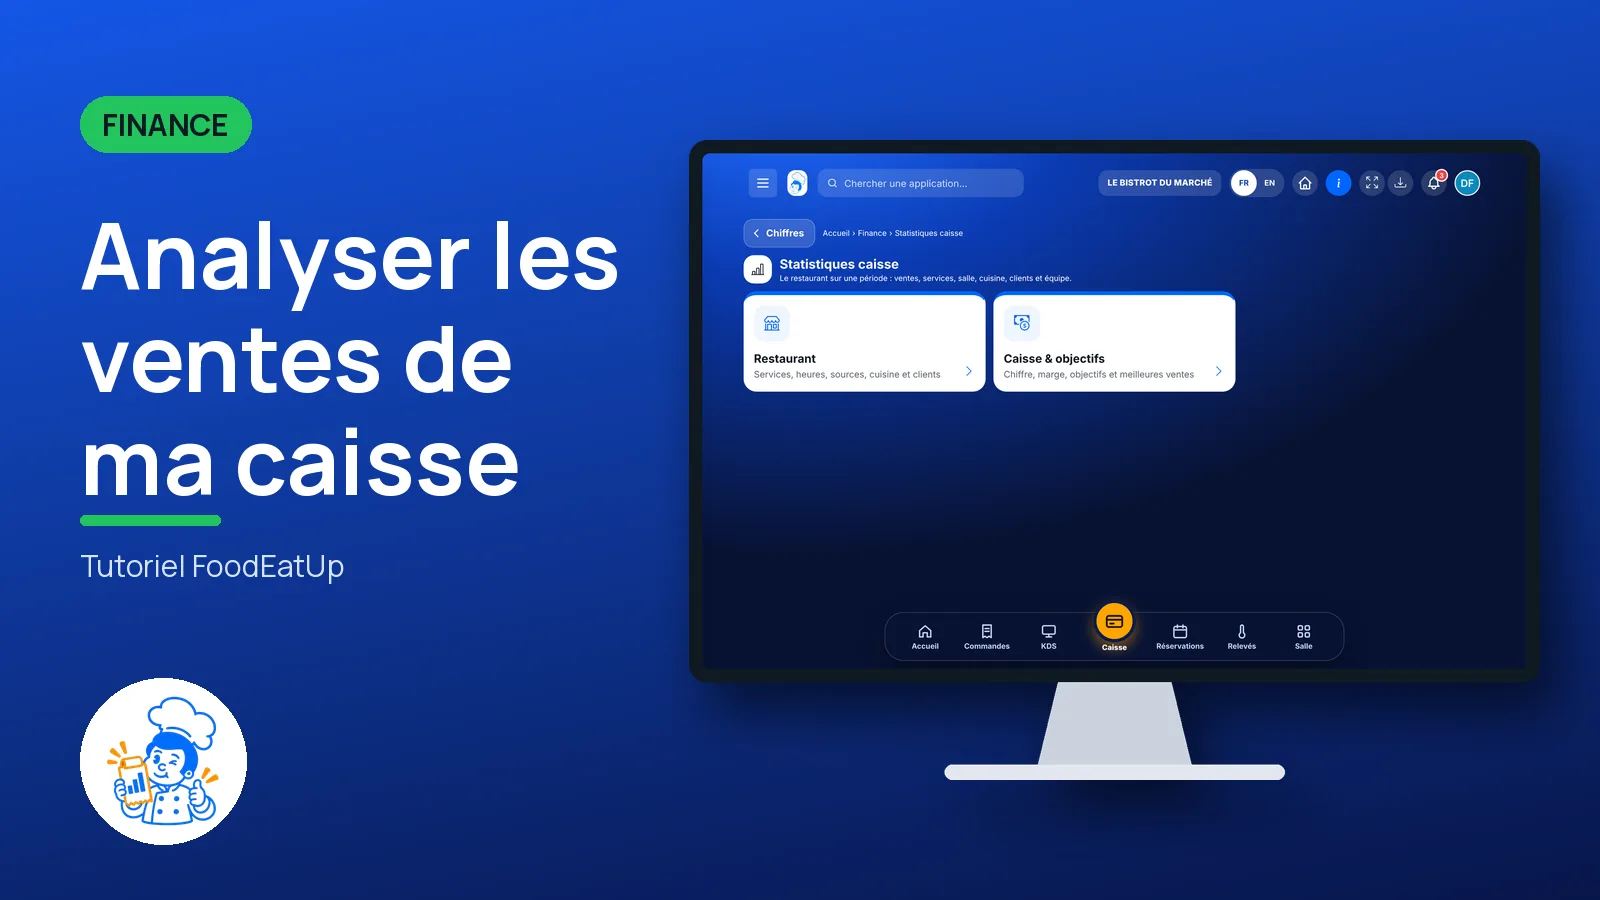
    From the home screen, open Finance then “Stats caisse”. Two cards: “Restaurant” and “Caisse & objectifs”.

    Till statistics
  2. 2Step 2

    Pick the period

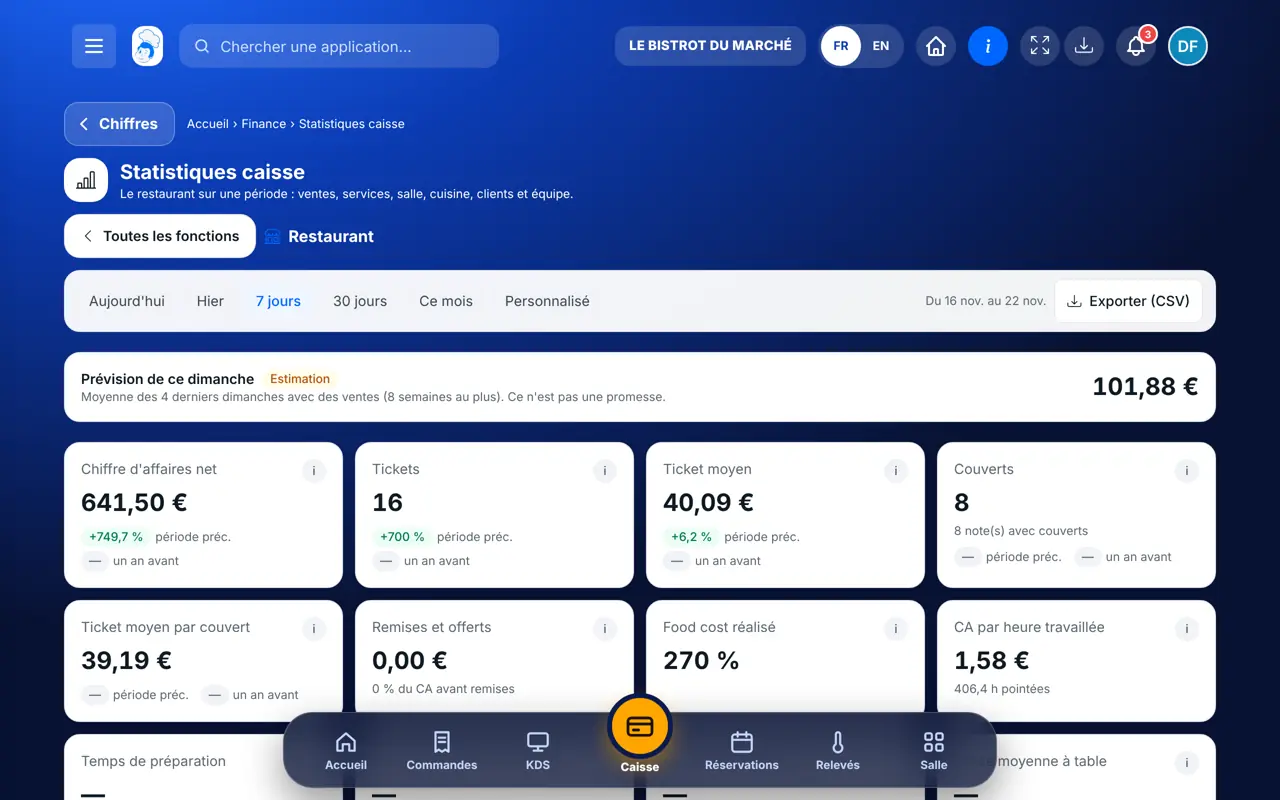
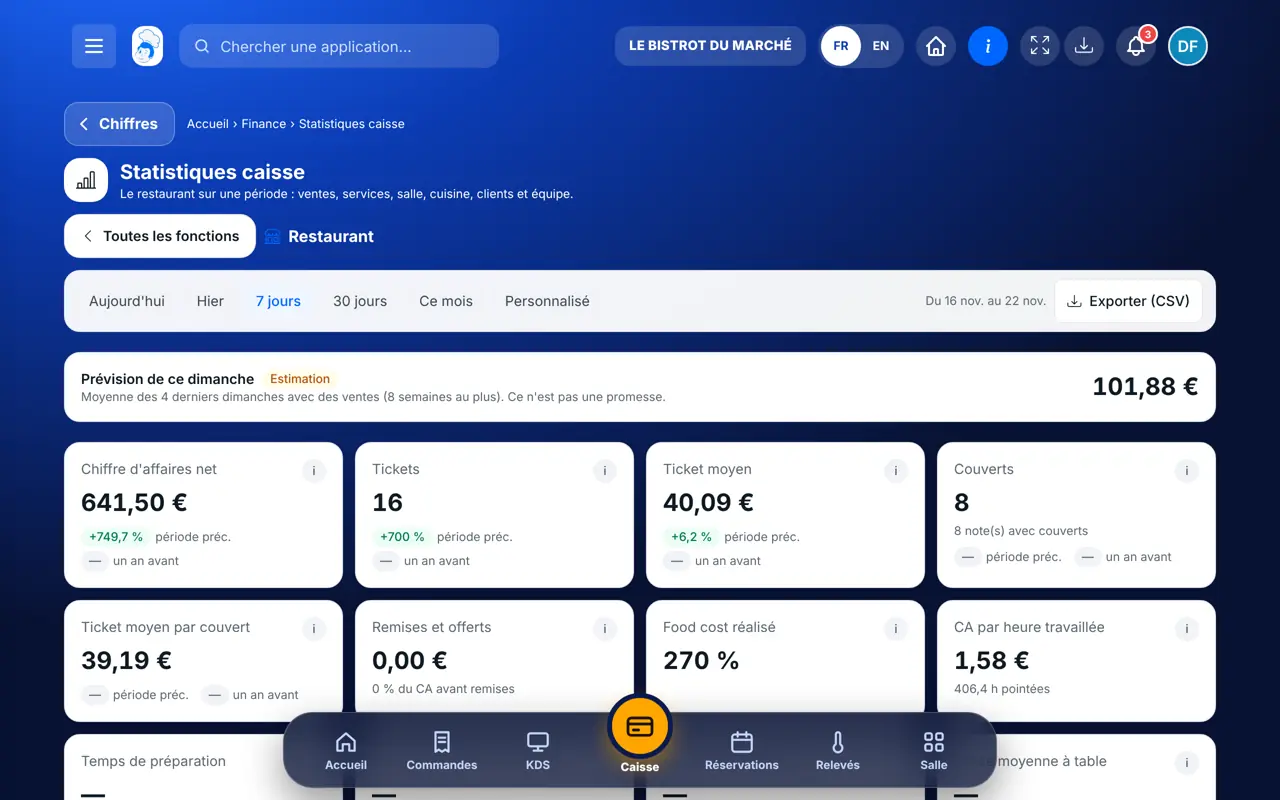
    Tap “Restaurant”, then “Aujourd’hui”, “7 jours”, “30 jours”, “Ce mois” or “Personnalisé”. The key figures update.

    The Restaurant view
  3. 3Step 3

    Read the details

    Below: turnover by day, by service, “Quand vend-on le plus ?”, payment methods, sources, servers, discounts and cancellations.

  4. 4Step 4

    Set a target

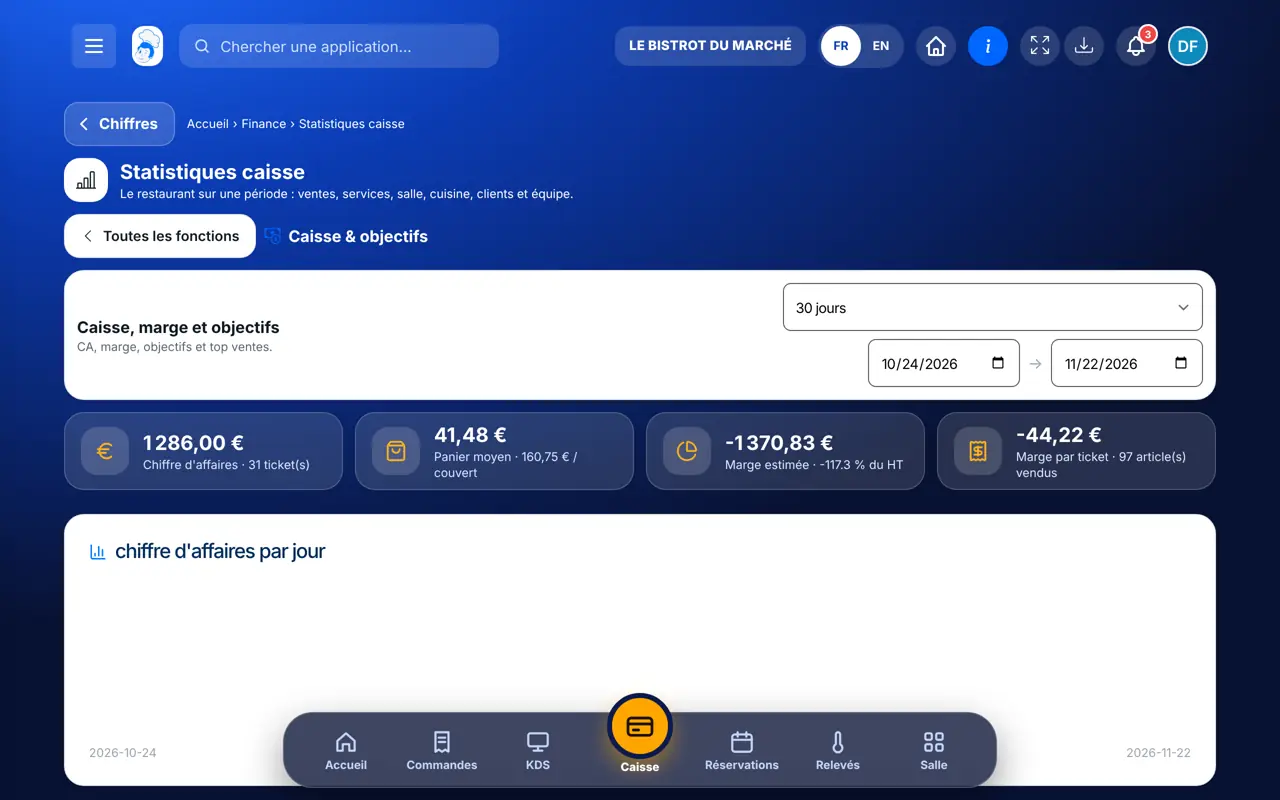
    Tap “Caisse & objectifs”, then “Nouvel objectif”: the target, the dates, one dish or the whole team.

    Sales targets
  5. 5Step 5

    Export

    Tap “Exporter (CSV)” in the Restaurant view to keep the period in a spreadsheet.

The result

The result

The period read by service, by hour and by source, with the best sellers and the dishes that sell least.

The result : Analyse my till sales

Owner and employee: what changes

The owner

Reads all the statistics and sets the team’s targets.

Stats caisse — The owner

The employee

With the right to view the financial dashboard, reads the statistics. Creating a target needs the right to manage sales targets.

Stats caisse — The employee

Do it with your assistant

Claude, ChatGPT or Mistral’s Le Chat, connected to FoodEatUp. Copy the request and replace your establishment number.

My till over 30 days

In FoodEatUp, for my establishment [number], give me the till statistics for the last 30 days: turnover, tickets, average basket and busiest hours.

What you getTurnover, number of tickets, average basket and the day and hour breakdown.

Tools used : get_pos_analytics

Tops and flops

In FoodEatUp, for my establishment [number], which dishes sell best and which sell least this month?

What you getThe best sellers and the active dishes that sell least, zero sales included.

Tools used : get_top_flop_products

My targets

In FoodEatUp, for my establishment [number], how are my sales targets doing?

What you getEach target with what is done, what is left, the days remaining and the ranking.

Tools used : list_sales_targets

What you gain

Your peak hours

You know when to add staff.

Honest figures

Training mode excluded, credit notes deducted.

A motivated team

Targets and a server ranking.

Simple export

The period as CSV, ready for a spreadsheet.

The Chef’s tip

Check “Les moins vendus” every month: a dish that never sells costs stock and prep time.

What is linked to this screen

In FoodEatUp, one action triggers others. Here are the screens that work with this one.

Frequently asked questions

Are training-mode sales counted?

No. A sale is a paid bill outside training mode, as in the Z report.

Why do some figures show “—”?

When data needed for the calculation is missing (covers not entered, for example), the screen shows “—” and says why, instead of a false zero.

Who can create a target?

The owner, or an employee with the right to manage sales targets.

Text version for AI assistants →

Share this tutorial

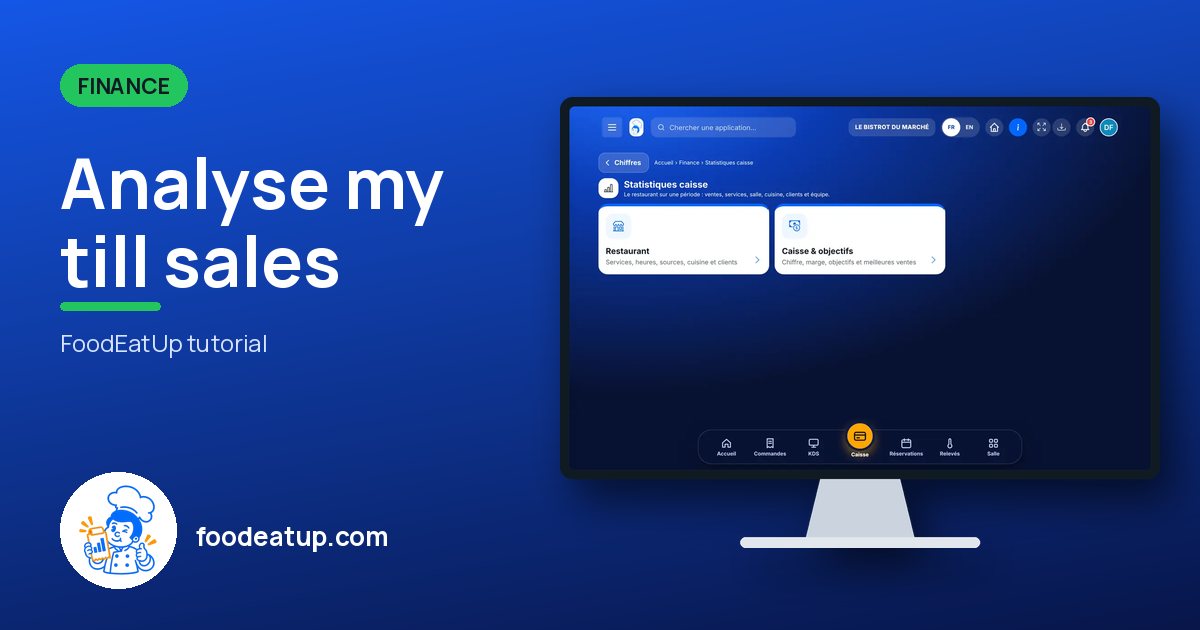
Send it to your team, your partner or your accountant. The image below appears in the message.

Share preview : Analyse my till sales
WhatsAppLinkedInFacebookEmail

Send to an AI assistant

Claude, ChatGPT or Le Chat read this tutorial and explain it to you. Connected to FoodEatUp, they do it with you.

Read this FoodEatUp tutorial: https://foodeatup.com/en/academy/finance/pos-analytics.md Explain it to me simply, step by step, then help me do it in my restaurant. If FoodEatUp is connected to you, do it with me and show me the preview before every change.

ClaudeLe ChatChatGPT

Open in my software

Type your establishment number: the link takes you straight to this screen. The number stays on this device.

Discover the till (in French) →

You can read it in the software address: foodeatup.com/establishment/number/…