Aller au contenu
Finance · Statistiques

See my sales over a period

The Statistics screen sums up your invoices over a period: sales, orders, gross margin, unique customers and best products, compared with the previous period.

  • Computer
  • 4 steps
  • Level : Beginner
See my sales over a period : The Statistics screen

Who is it for?

  • Patron / gérant
  • Directeur
  • Responsable multi-sites

Roles with access

  • Gérant·e
  • Siège (réseau)
  • Boutique (réseau)
  • Franchisé·e (réseau)
  • Directeur·rice d'établissement
  • Responsable commercial
  • Responsable siège
  • Comptable

The owner always has access. See what each role sees →

Recommended hardware

Computer

A computer, a tablet or a phone: the screen adapts.

See the hardware →

What it is for

  • Follow total sales and the number of orders over the chosen period.
  • See gross margin and the number of unique customers.
  • Find the products that earn the most.

Why set it up

  • Each figure is compared with the previous period of the same length.
  • Sales come from your invoices, cancelled invoices excluded.
  • Gross margin deducts the period’s stock withdrawals.

The same screen, on every device

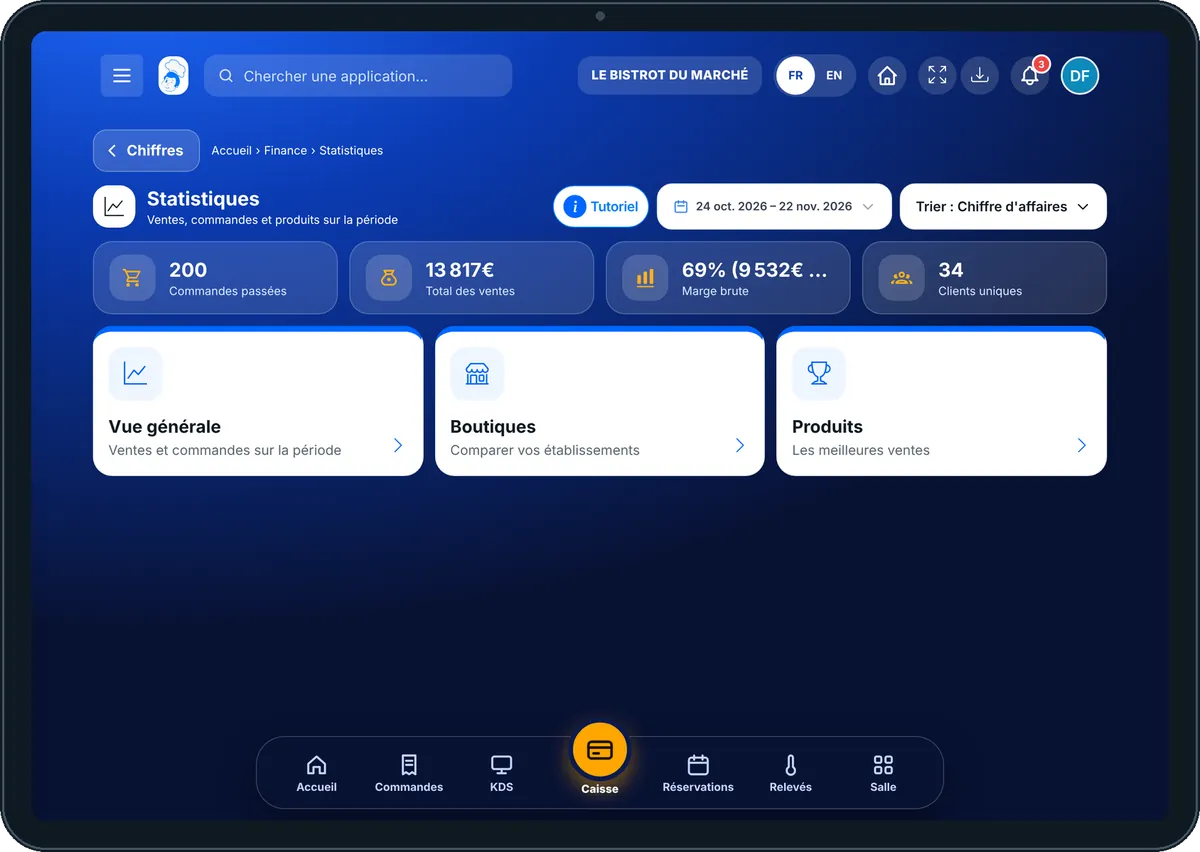
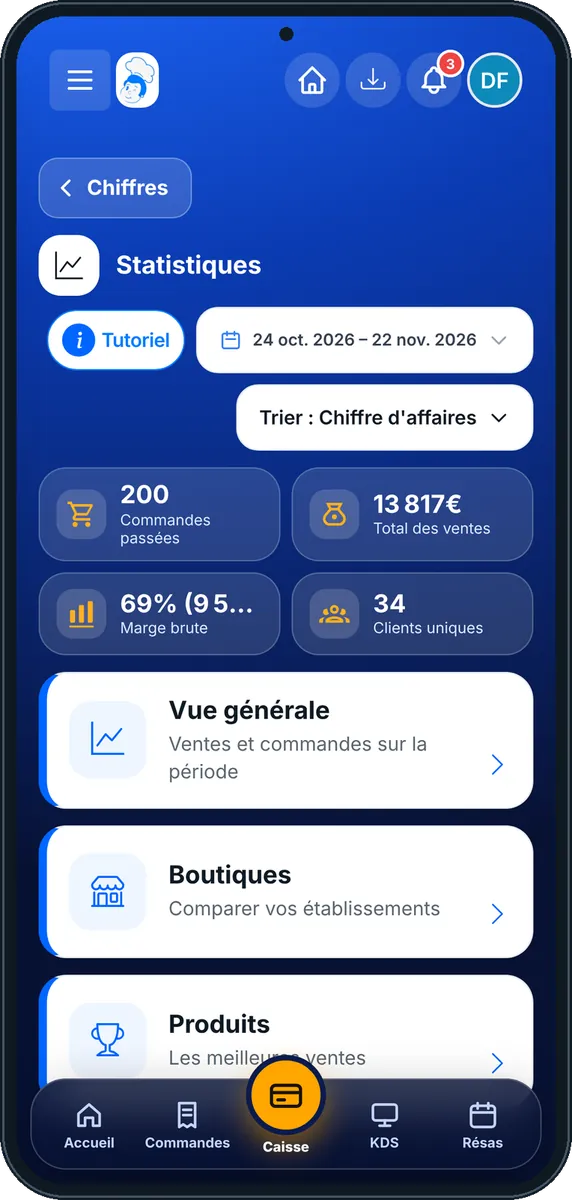
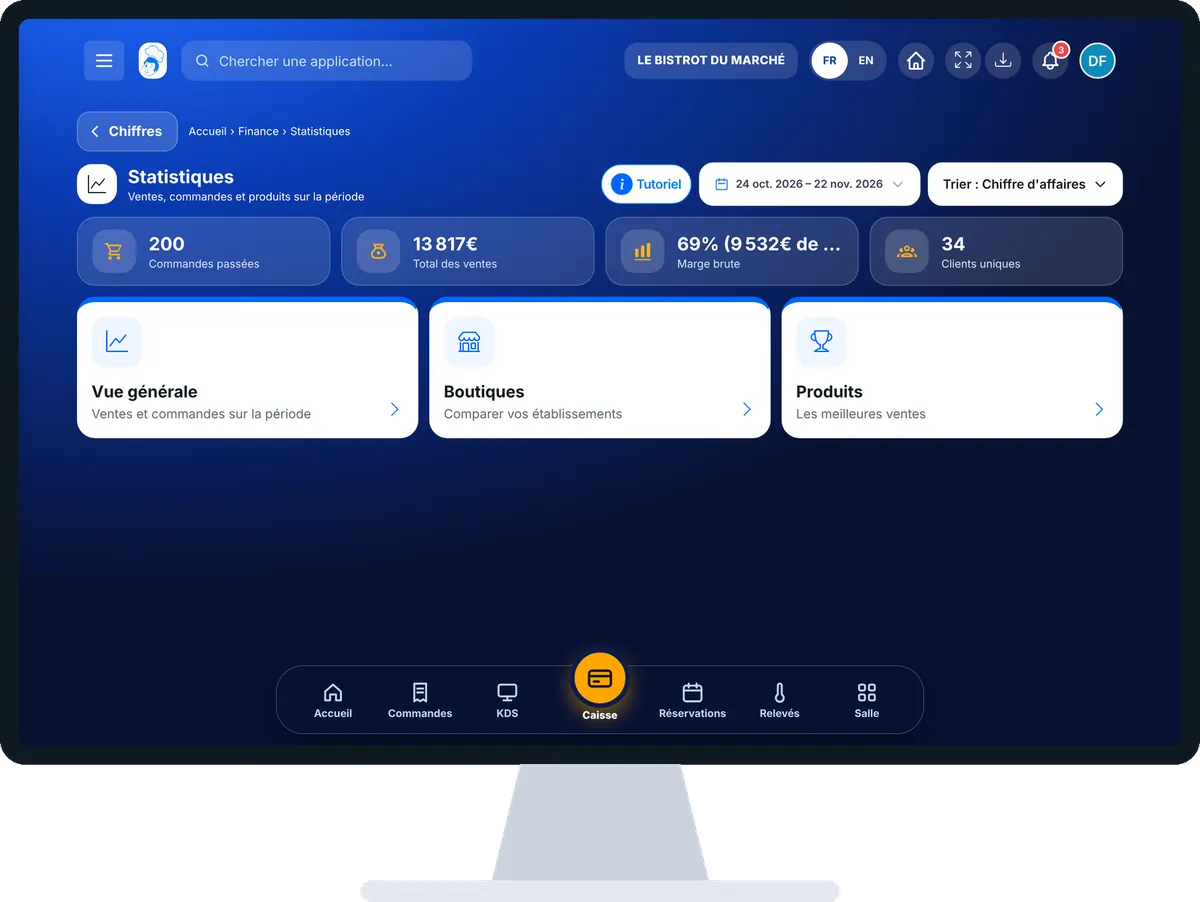
The real software screens, as they appear on each device.

Statistiques — On the tablet
On the tablet
Statistiques — On the phone
On the phone
Statistiques — On the computer
On the computer

Step by step

See my sales over a period : 4 steps, with the real software screens.

  1. 1Step 1

    Open the statistics

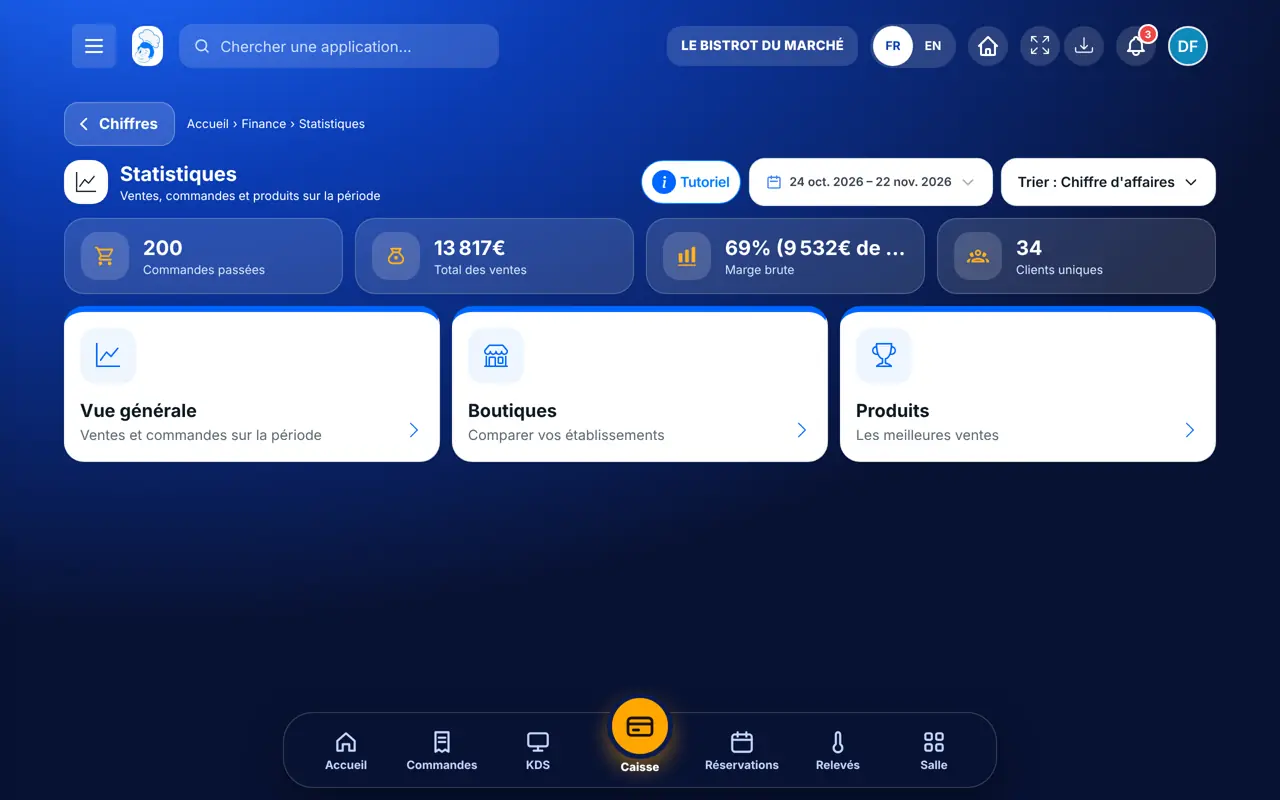
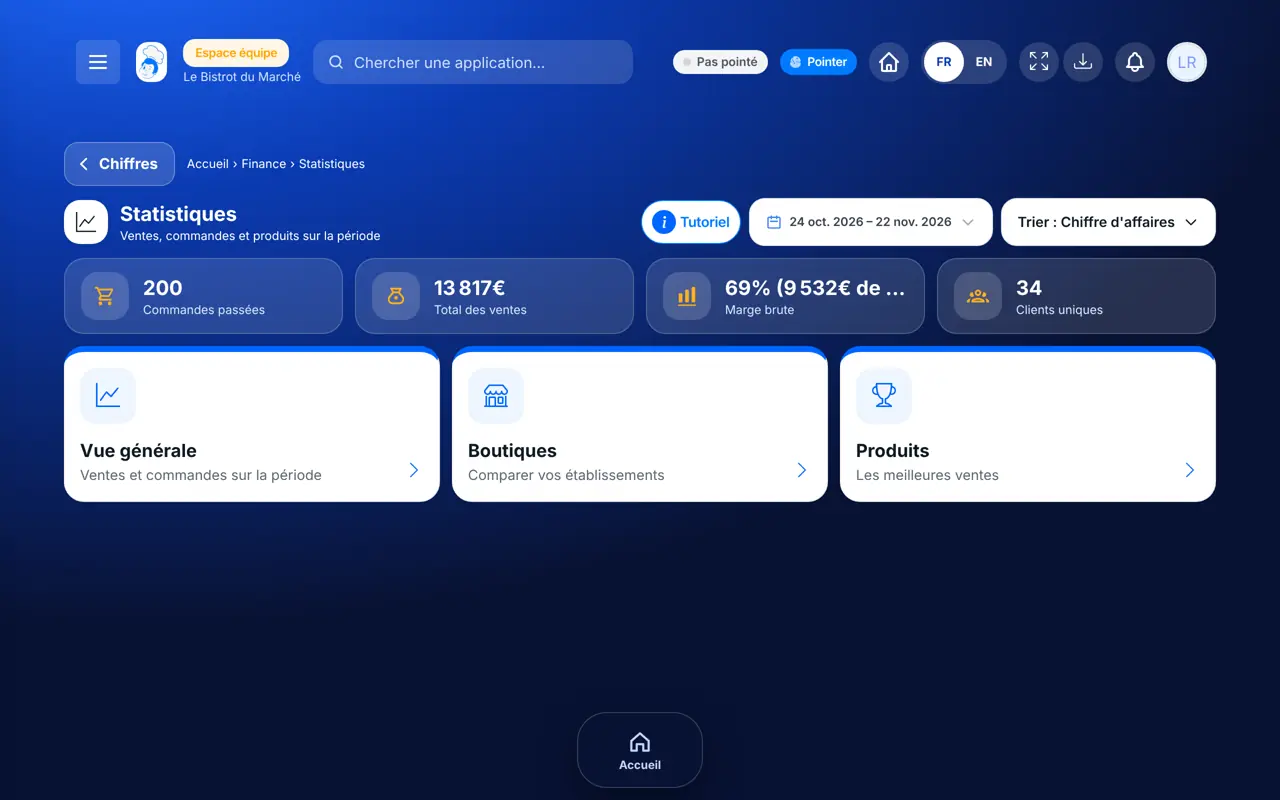
    From the home screen, open Finance then “Statistiques”. Three cards: “Vue générale”, “Boutiques”, “Produits”.

    The Statistics screen
  2. 2Step 2

    Pick the period

    Tap the date at the top right: “7 j”, “30 j”, “90 j”, “1 an”, or two dates, then “Appliquer”.

  3. 3Step 3

    Read the products

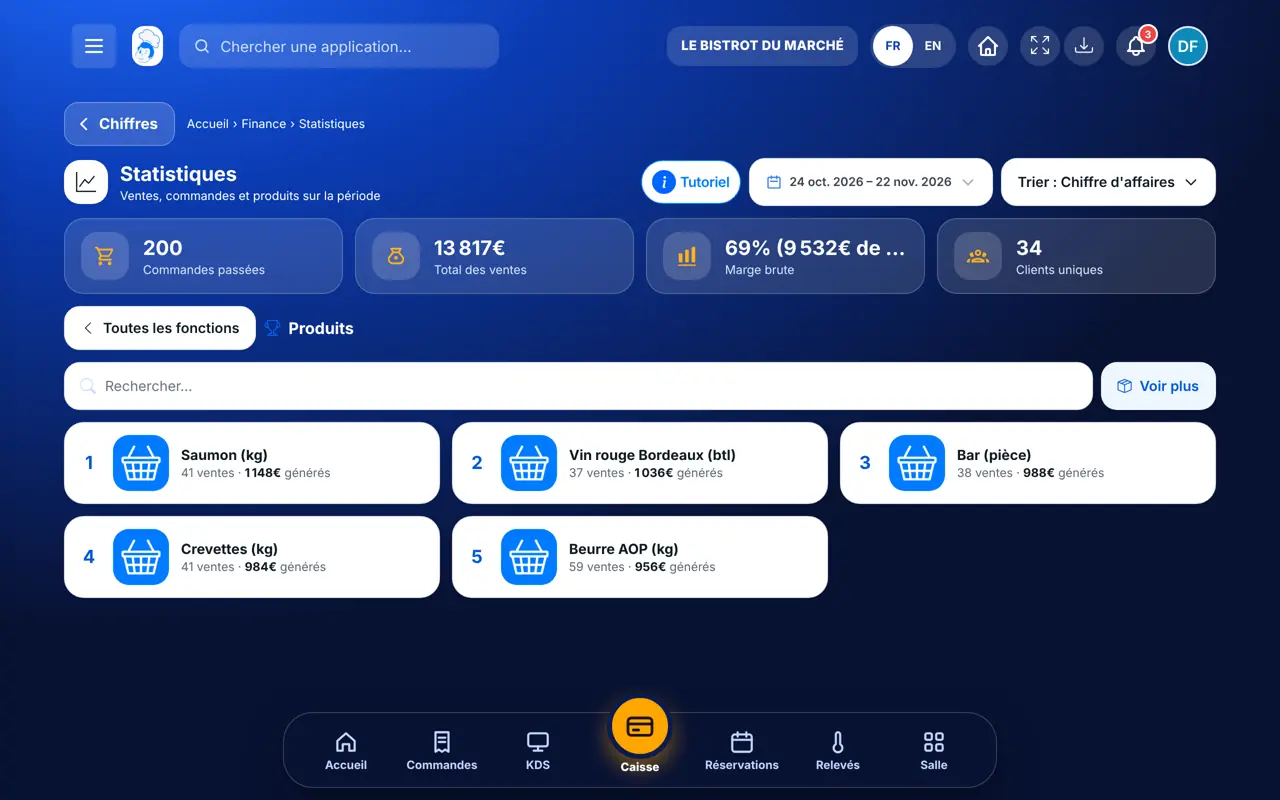
    Tap “Produits”: the best sellers, with a search by name.

    Best sellers
  4. 4Step 4

    Compare

    In “Vue générale”, each card shows its change against the previous period.

The result

The result

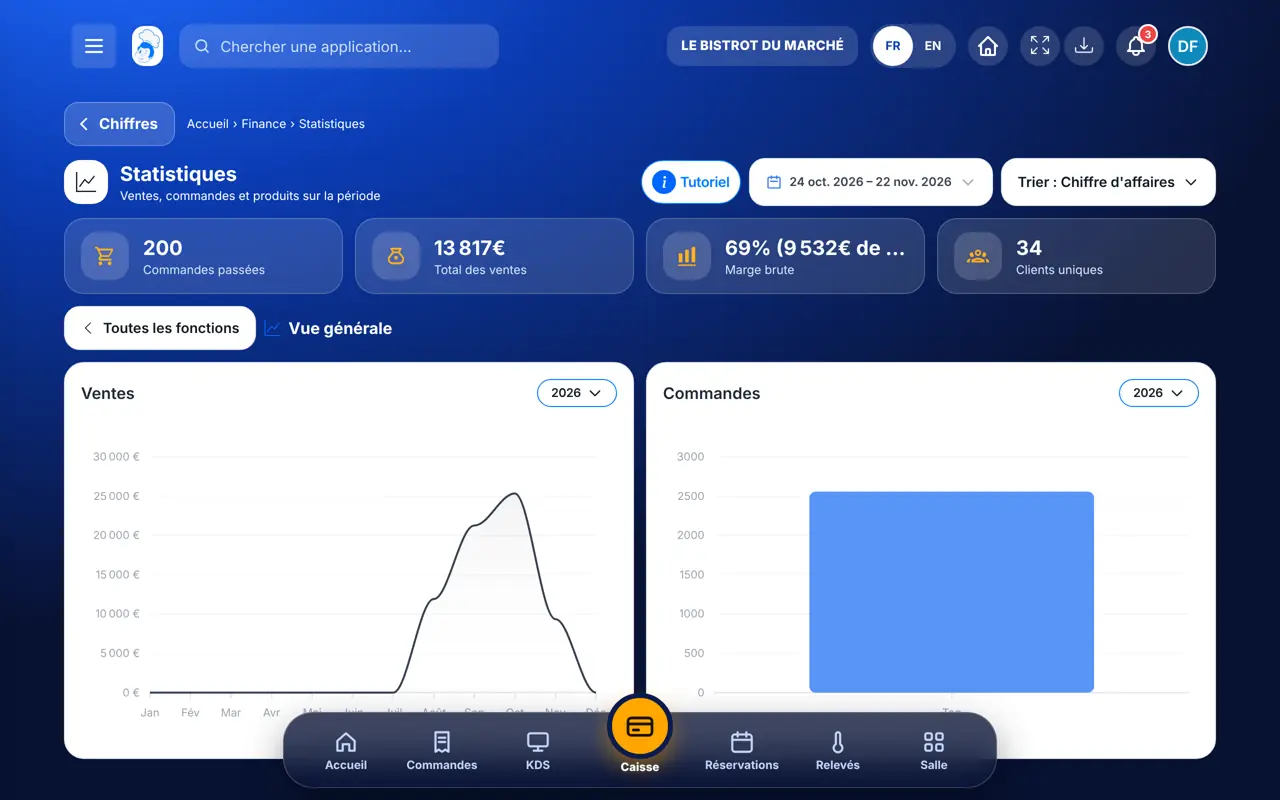
The period in four figures (orders, sales, gross margin, unique customers) and the sales and orders charts.

The result : See my sales over a period

Owner and employee: what changes

The owner

Reads the statistics over the period of their choice.

Statistiques — The owner

The employee

With the right to view statistics, reads the same figures.

Statistiques — The employee

Do it with your assistant

Claude, ChatGPT or Mistral’s Le Chat, connected to FoodEatUp. Copy the request and replace your establishment number.

My month’s statistics

In FoodEatUp, for my establishment [number], give me this month’s statistics: sales, orders, average basket and trend.

What you getTurnover, orders, average basket and the comparison with the previous period.

Tools used : get_dashboard_statistics

Over a set period

In FoodEatUp, for my establishment [number], compare my sales from [start date] to [end date] with the period before.

What you getThe period’s figures and their change.

Tools used : get_dashboard_statistics

The period’s invoices

In FoodEatUp, for my establishment [number], give me the month’s financial summary: invoiced, collected, unpaid and expenses.

What you getTurnover invoiced, collected, unpaid, expenses and margin.

Tools used : finance_summary

What you gain

The big picture

Four figures for the period.

Comparison

With the previous period, automatically.

Best products

What earns the most.

On every screen

Readable on a phone as on a desk.

The Chef’s tip

For till sales hour by hour, use “Stats caisse”; this screen sums up your invoices.

What is linked to this screen

In FoodEatUp, one action triggers others. Here are the screens that work with this one.

Frequently asked questions

Where do the sales shown come from?

From the establishment’s invoices over the period, cancelled invoices excluded.

How is gross margin calculated?

Total sales minus the value of stock withdrawals over the same period.

Why aren’t all my till sales here?

This screen reads invoices. Till sales are read in “Stats caisse”.

Text version for AI assistants →

Share this tutorial

Send it to your team, your partner or your accountant. The image below appears in the message.

Share preview : See my sales over a period
WhatsAppLinkedInFacebookEmail

Send to an AI assistant

Claude, ChatGPT or Le Chat read this tutorial and explain it to you. Connected to FoodEatUp, they do it with you.

Read this FoodEatUp tutorial: https://foodeatup.com/en/academy/finance/statistiques.md Explain it to me simply, step by step, then help me do it in my restaurant. If FoodEatUp is connected to you, do it with me and show me the preview before every change.

ClaudeLe ChatChatGPT

Open in my software

Type your establishment number: the link takes you straight to this screen. The number stays on this device.

Discover financial management (in French) →

You can read it in the software address: foodeatup.com/establishment/number/…