My indicators
In FoodEatUp, for my establishment [number], give me the AnalytiX BI indicators for the last 30 days.
What you getTurnover, costs, margin and average ticket, with the same calculations as the screen.
Tools used : get_bi_kpis
 Finance · AnalytiX BI
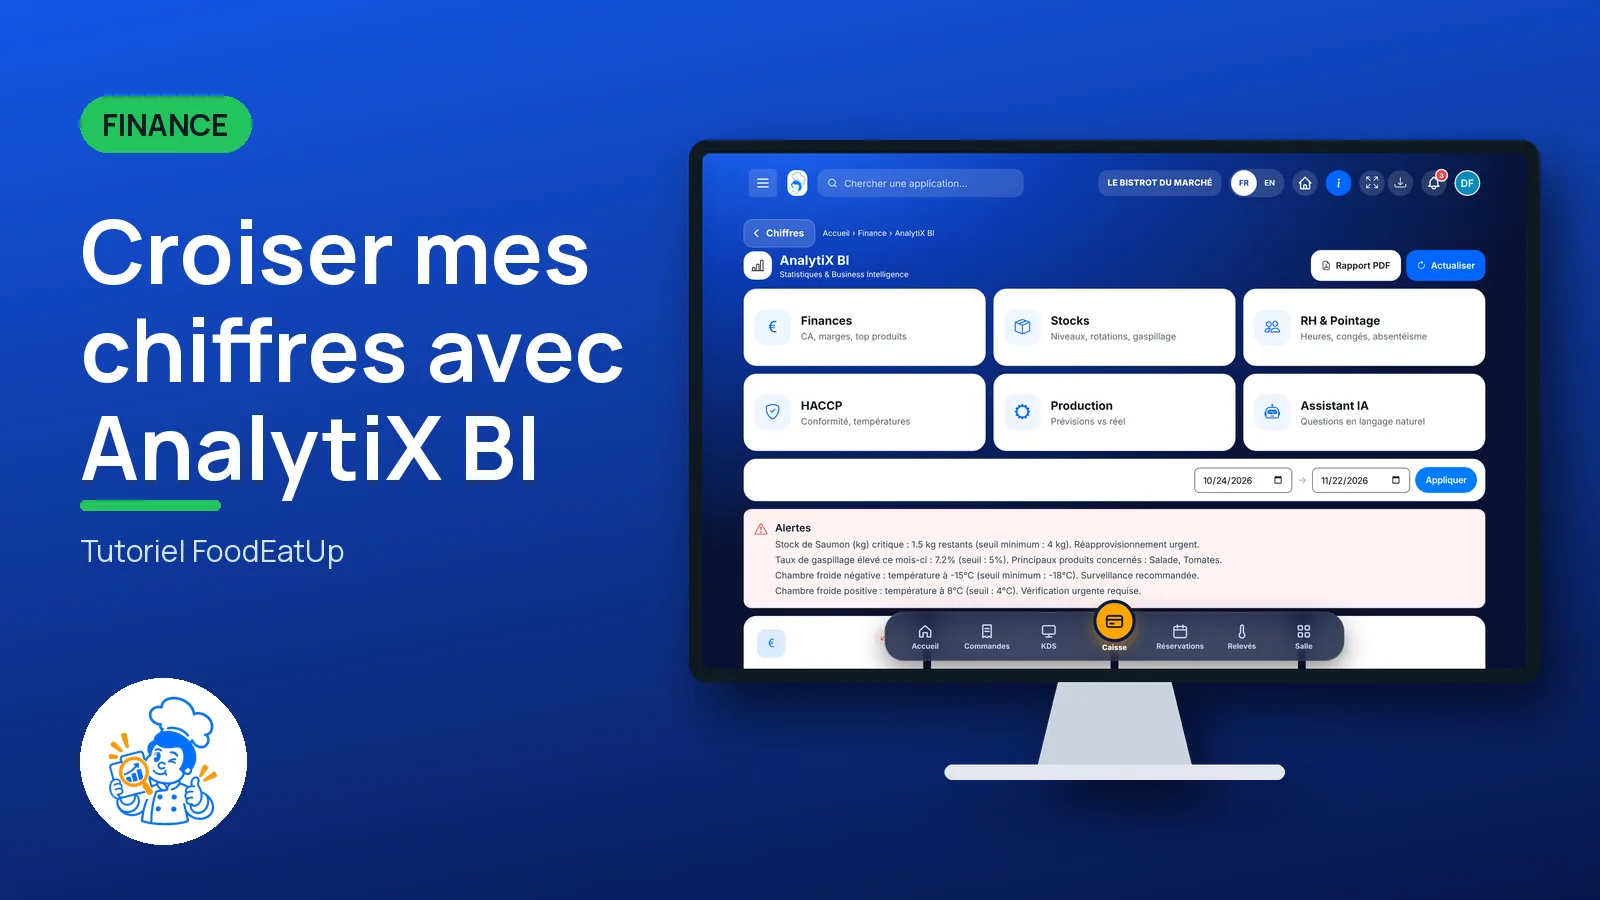
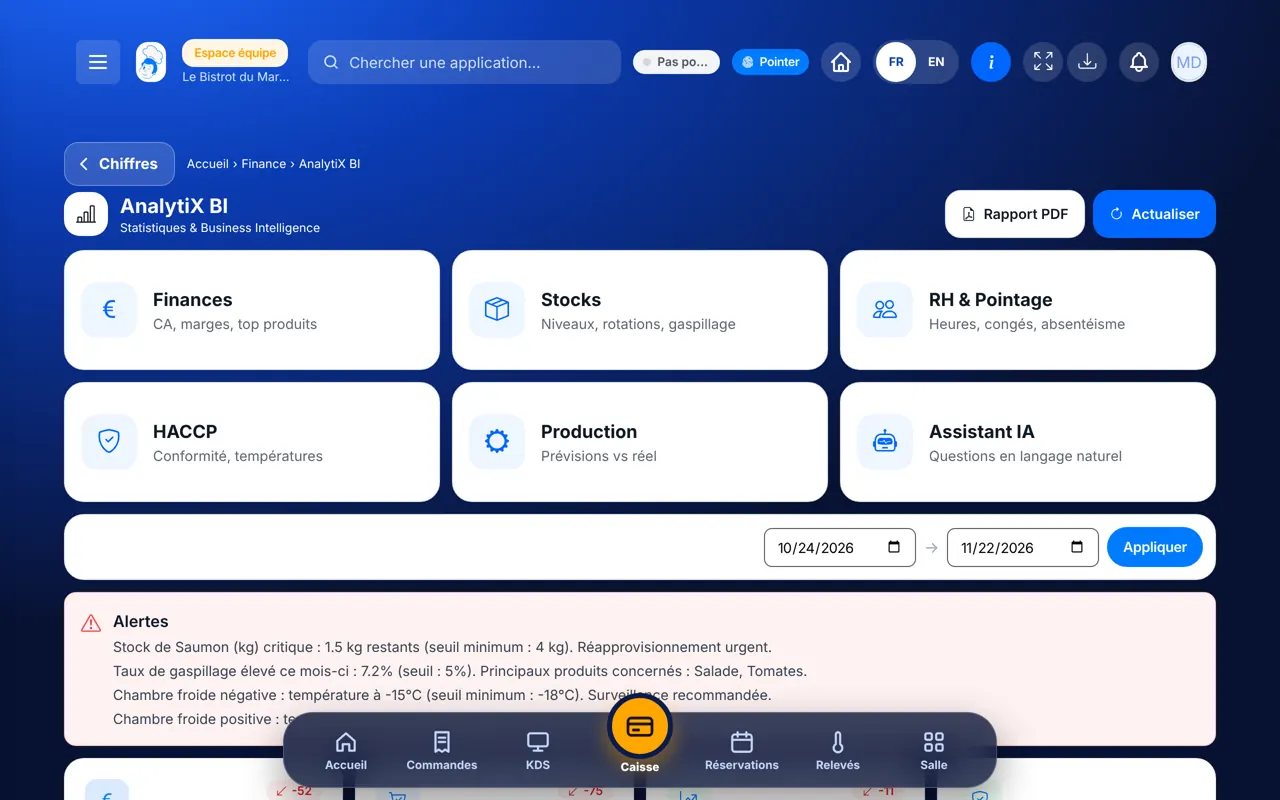
AnalytiX BI brings your indicators together over a period: turnover, orders, gross margin and HACCP score, with the anomalies found. Six analyses open as large cards: finance, stock, HR, HACCP, production and AI assistant.
 Directeur
 Responsable multi-sites
 Patron / gérant
 Franchisé
The owner always has access. See what each role sees →
A computer: cross analyses and the PDF report read best on a large screen.
The real software screens, as they appear on each device.
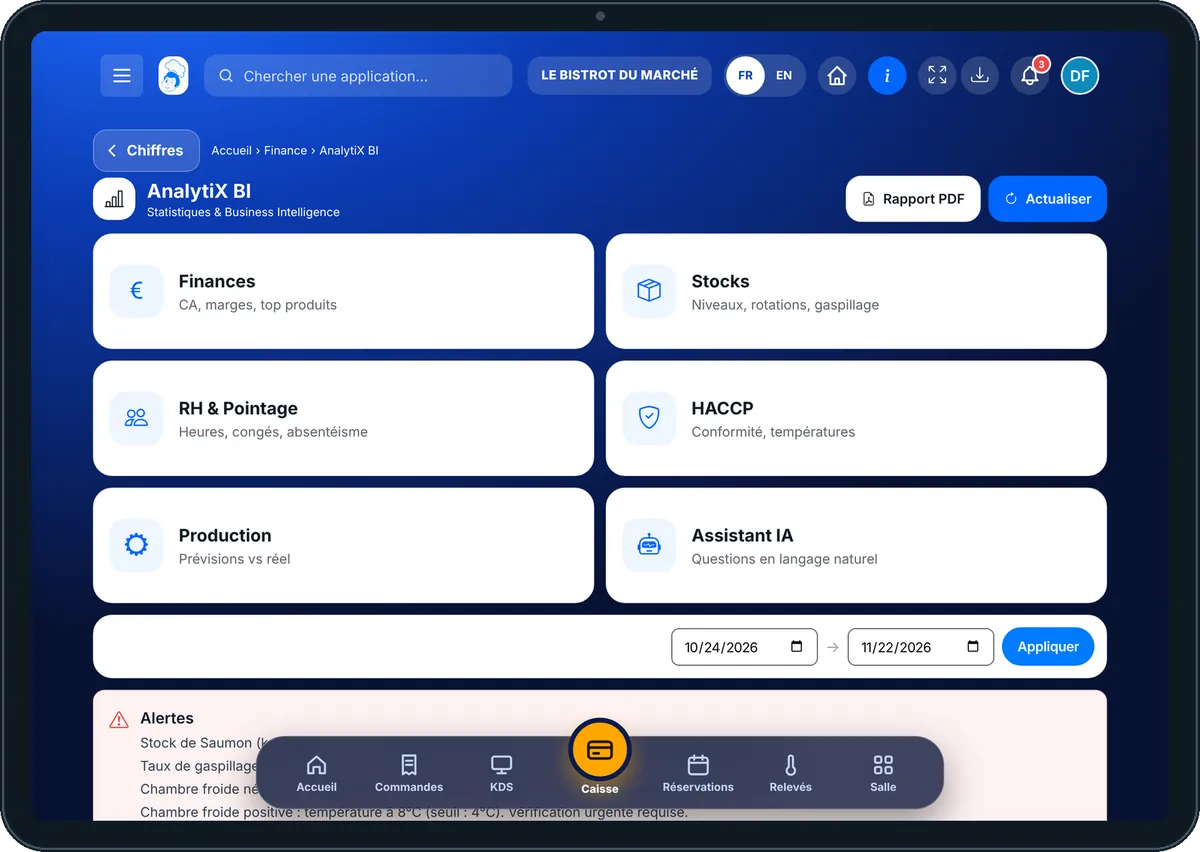
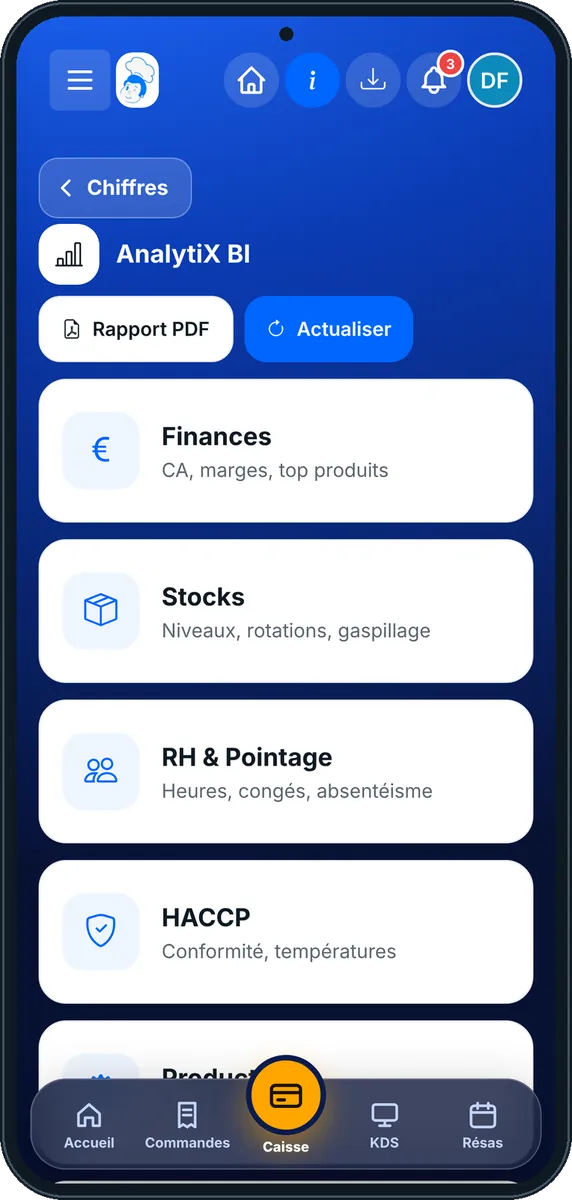
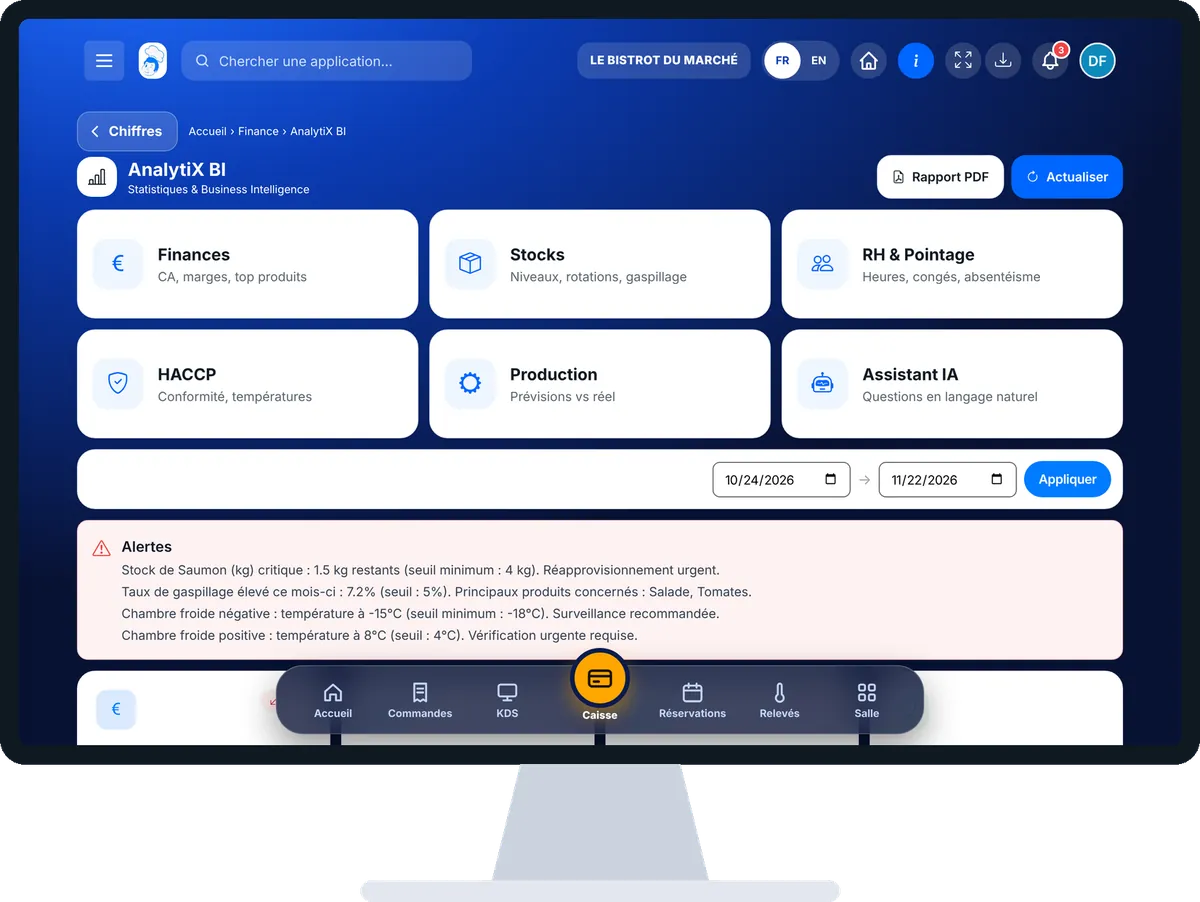
Cross my figures with AnalytiX BI : 5 steps, with the real software screens.
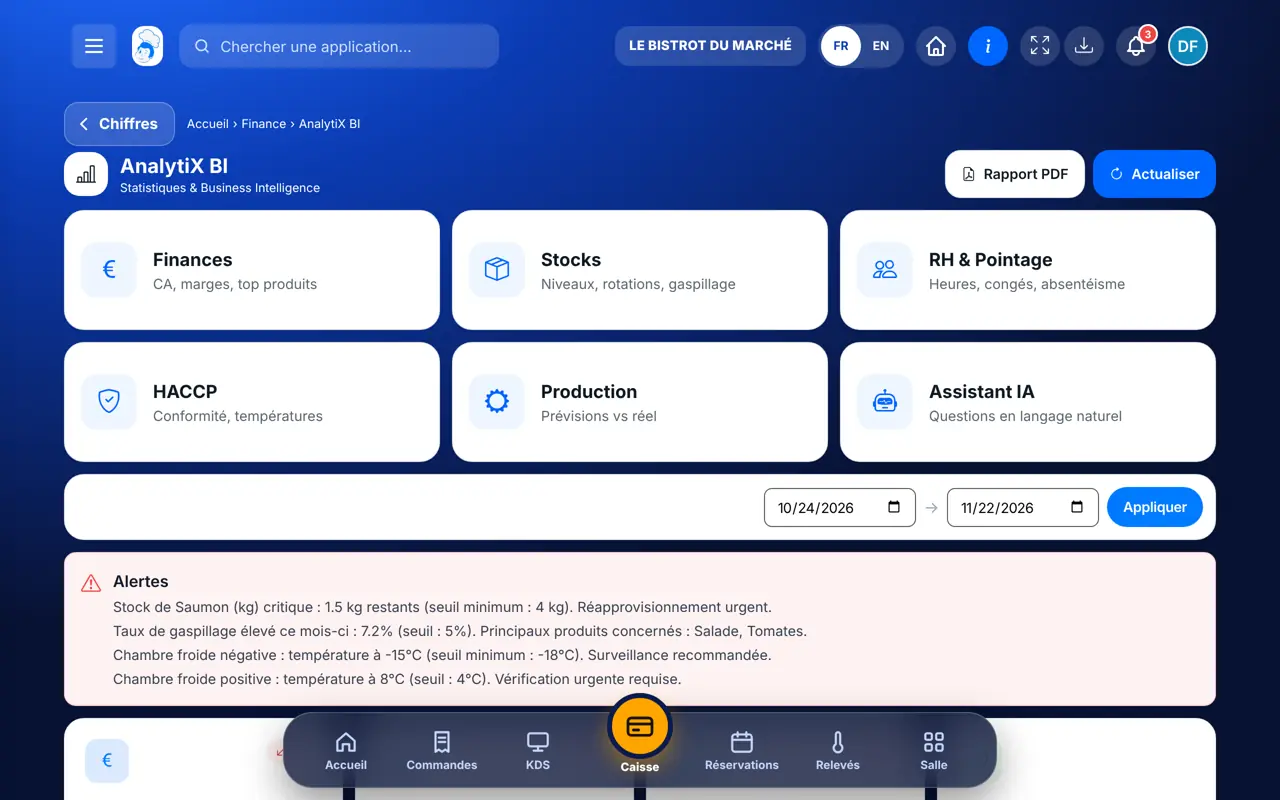
From the home screen, open Finance then “AnalytiX BI”. Six large cards: Finances, Stocks, RH & Pointage, HACCP, Production, Assistant IA.
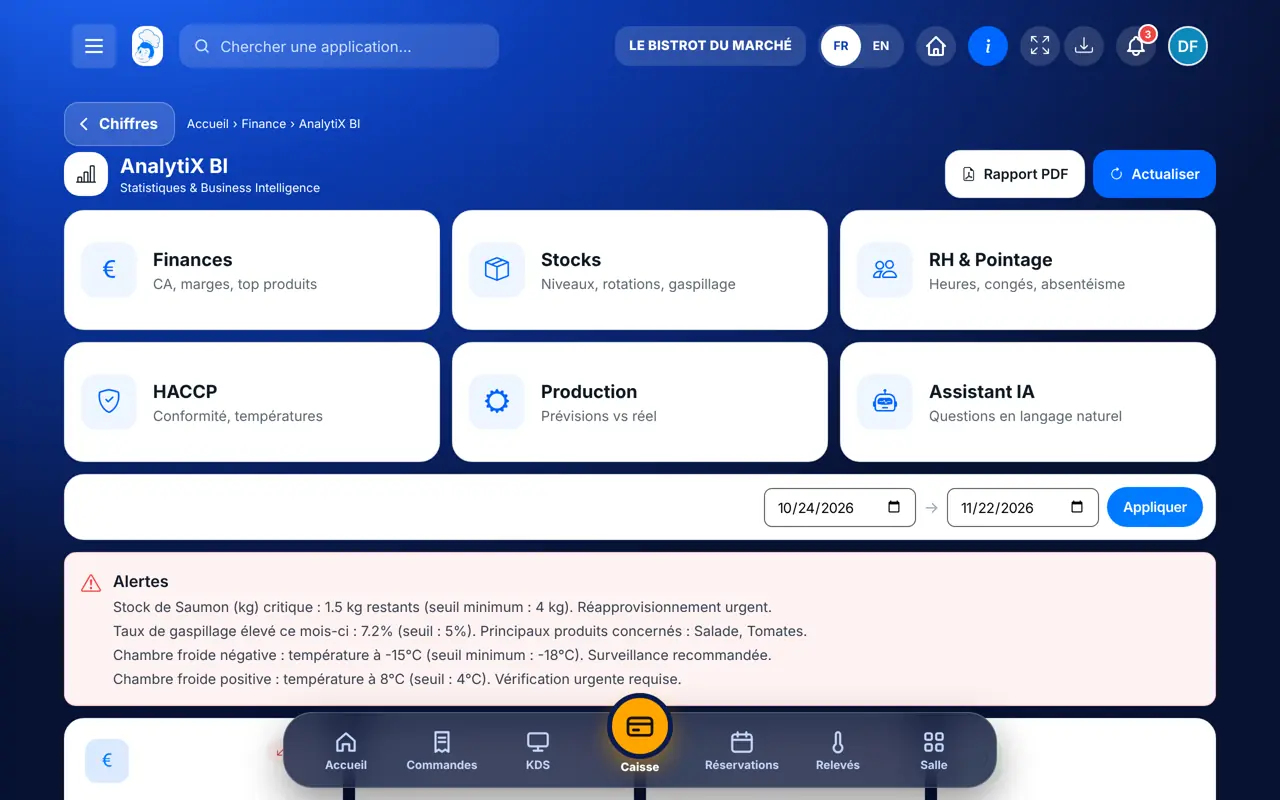
Below the cards, choose the dates and apply. The indicators and the turnover trend update.
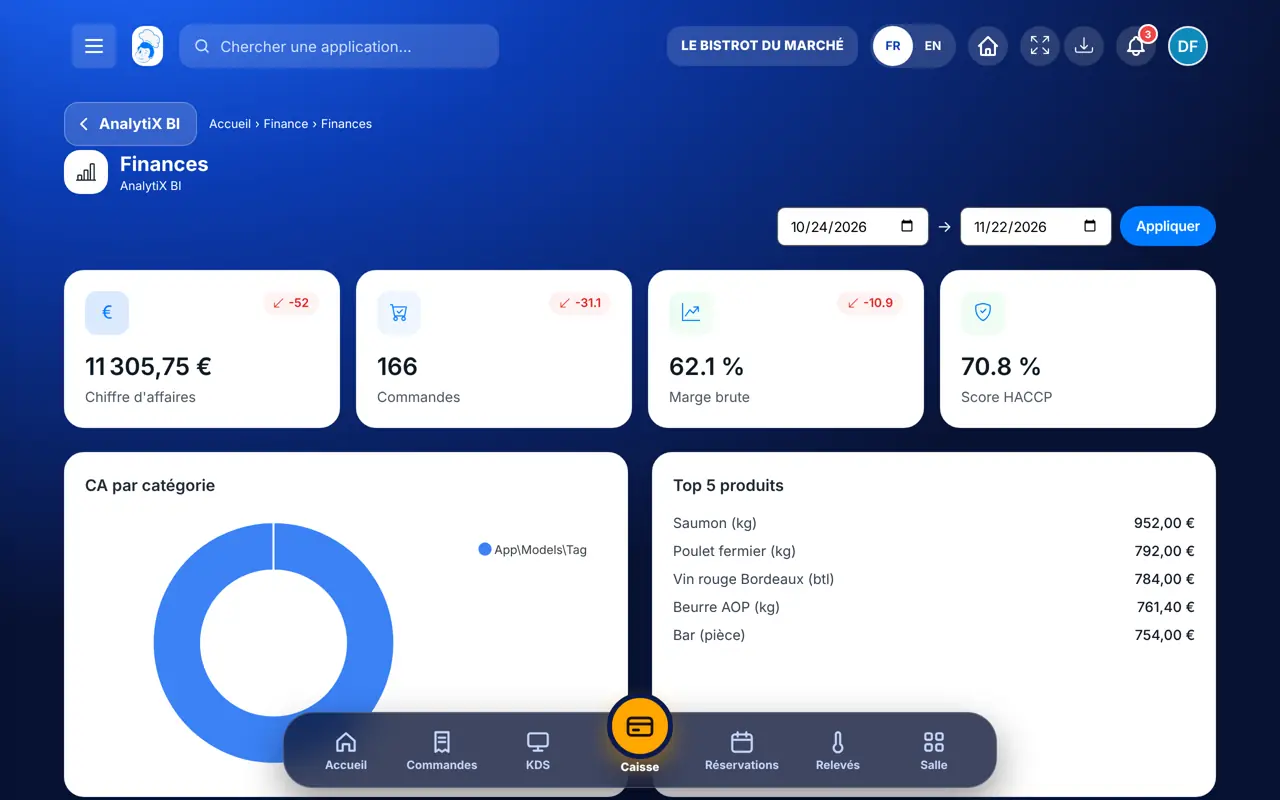
Tap “Finances”: turnover, margins and top products.
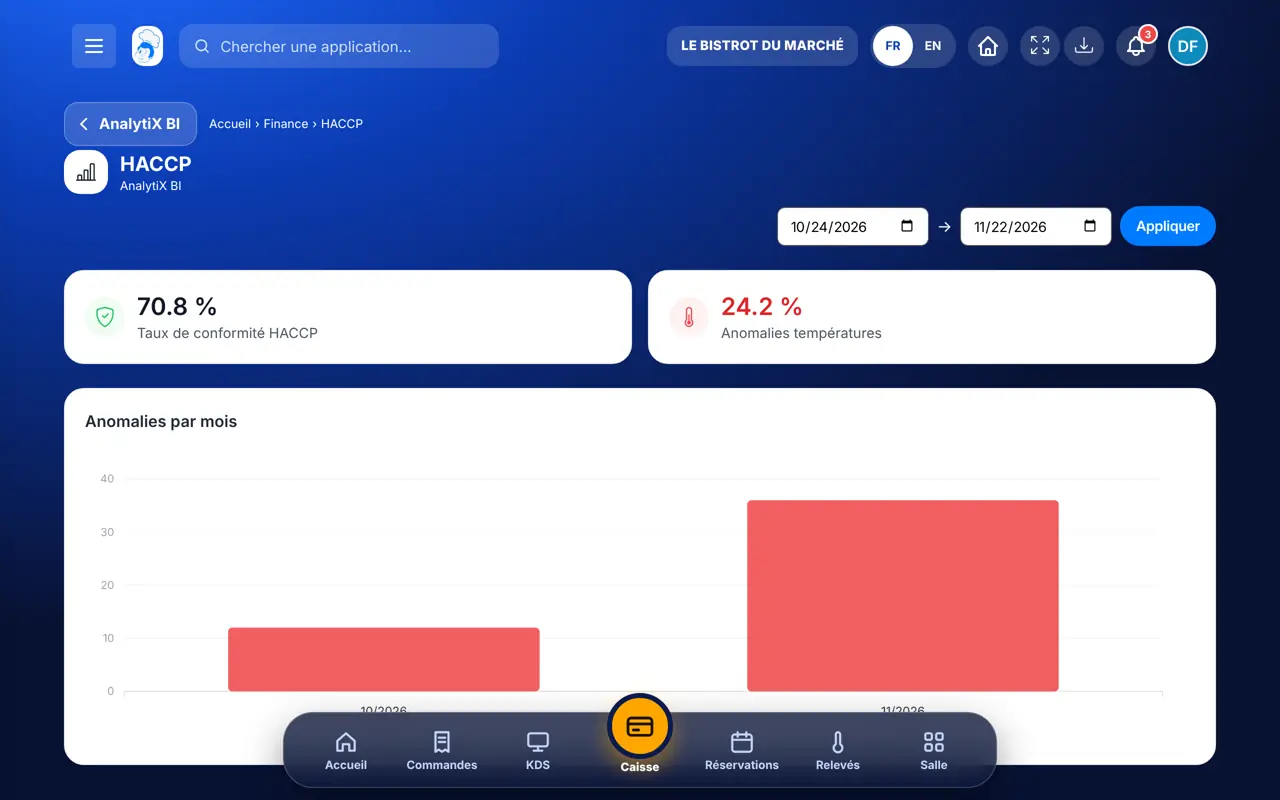
Tap “HACCP”: compliance and temperatures over the period.
Tap “Rapport PDF” at the top: the period goes into a PDF.
The period in four indicators, the turnover trend and, when there are any, the anomalies to look at.
Reads all the analyses and downloads the report.
With the right to view AnalytiX BI, reads the same analyses.
Claude, ChatGPT or Mistral’s Le Chat, connected to FoodEatUp. Copy the request and replace your establishment number.
In FoodEatUp, for my establishment [number], give me the AnalytiX BI indicators for the last 30 days.
What you getTurnover, costs, margin and average ticket, with the same calculations as the screen.
Tools used : get_bi_kpis
In FoodEatUp, for my establishment [number], which anomalies has AnalytiX BI found?
What you getThe gaps detected in sales, costs and stock.
Tools used : get_bi_alerts
In FoodEatUp, for my establishment [number], give me the link to the AnalytiX BI report from [start date] to [end date].
What you getA download link for the report, valid for 30 minutes.
Tools used : get_bi_report_pdf_link
Sales, stock, team and hygiene.
Gaps surface on their own.
One large card per area.
The period as a PDF.
Open AnalytiX BI before your Monday meeting: download the week’s PDF report and start from the anomalies.
In FoodEatUp, one action triggers others. Here are the screens that work with this one.
The compliance rate of your hygiene checks over the chosen period.
Yes: “Rapport PDF” at the top of the screen keeps the chosen period.
It opens from its card; access depends on your AnalytiX BI rights.
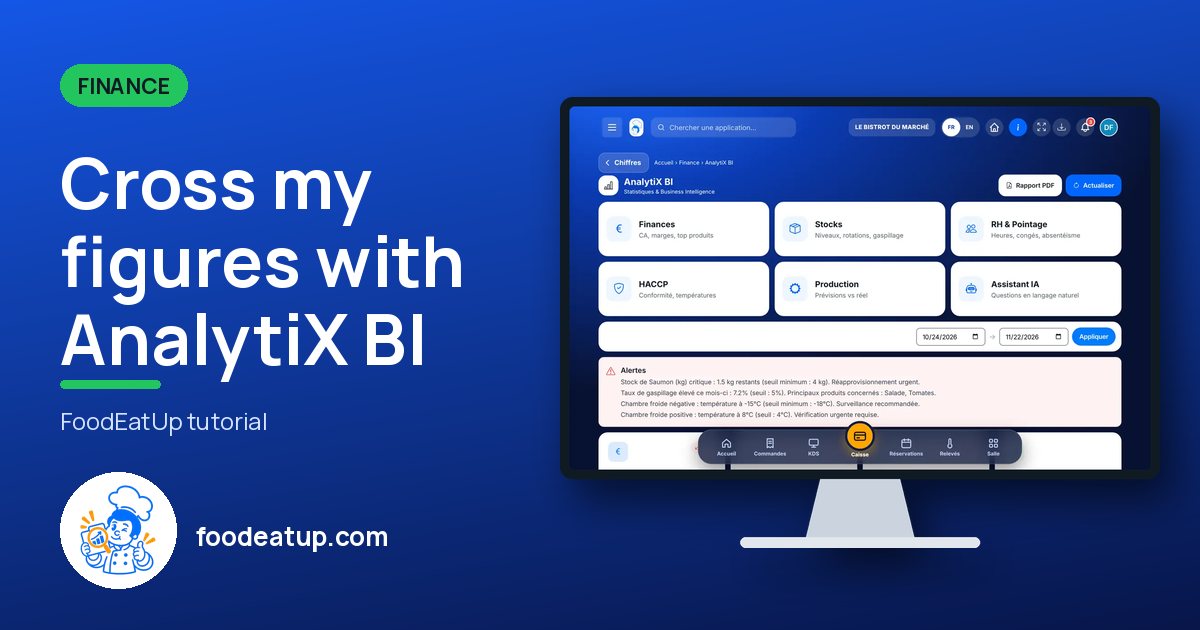
Send it to your team, your partner or your accountant. The image below appears in the message.
Claude, ChatGPT or Le Chat read this tutorial and explain it to you. Connected to FoodEatUp, they do it with you.
Read this FoodEatUp tutorial: https://foodeatup.com/en/academy/finance/bi-dashboard.md Explain it to me simply, step by step, then help me do it in my restaurant. If FoodEatUp is connected to you, do it with me and show me the preview before every change.
Type your establishment number: the link takes you straight to this screen. The number stays on this device.
Discover AI-driven management (in French) →
Répond avec les fiches du site, sans IA
Le chef cherche dans les fiches…
 Claude
 Le Chat
 ChatGPT