
Aller au contenu
Head office · KPIs

Read the network indicators

The network’s key figures for the month, each with its formula and source. Plus a dictionary, alerts, and what moves together across your shops.

  • Computer
  • 5 steps
  • Level : Intermediate
Read the network indicators : The network indicators for the month, with their shortcuts

Who is it for?

  • Responsable multi-sites
  • Directeur
  • Animateur réseau

Roles with access

  • Siège (réseau)
  • Responsable siège

The owner always has access. See what each role sees →

Recommended hardware

Computer

A computer at the head office, to prepare a management meeting or a catch-up with your managers.

See the hardware →

What it is for

  • Read this month’s indicators, and know how each one is worked out.
  • Be alerted when a shop falls behind or when estimated payroll weighs too much.
  • See whether two figures move together, for example team hours and revenue.

Why set it up

  • An indicator has only one definition, the same on every head-office page. No more debate about the calculation.
  • A missing figure shows “—” with its reason. It is never replaced by zero.
  • Correlations are presented with care: two figures moving together do not prove that one causes the other. The screen reminds you.

The same screen, on every device

The real software screens, as they appear on each device.

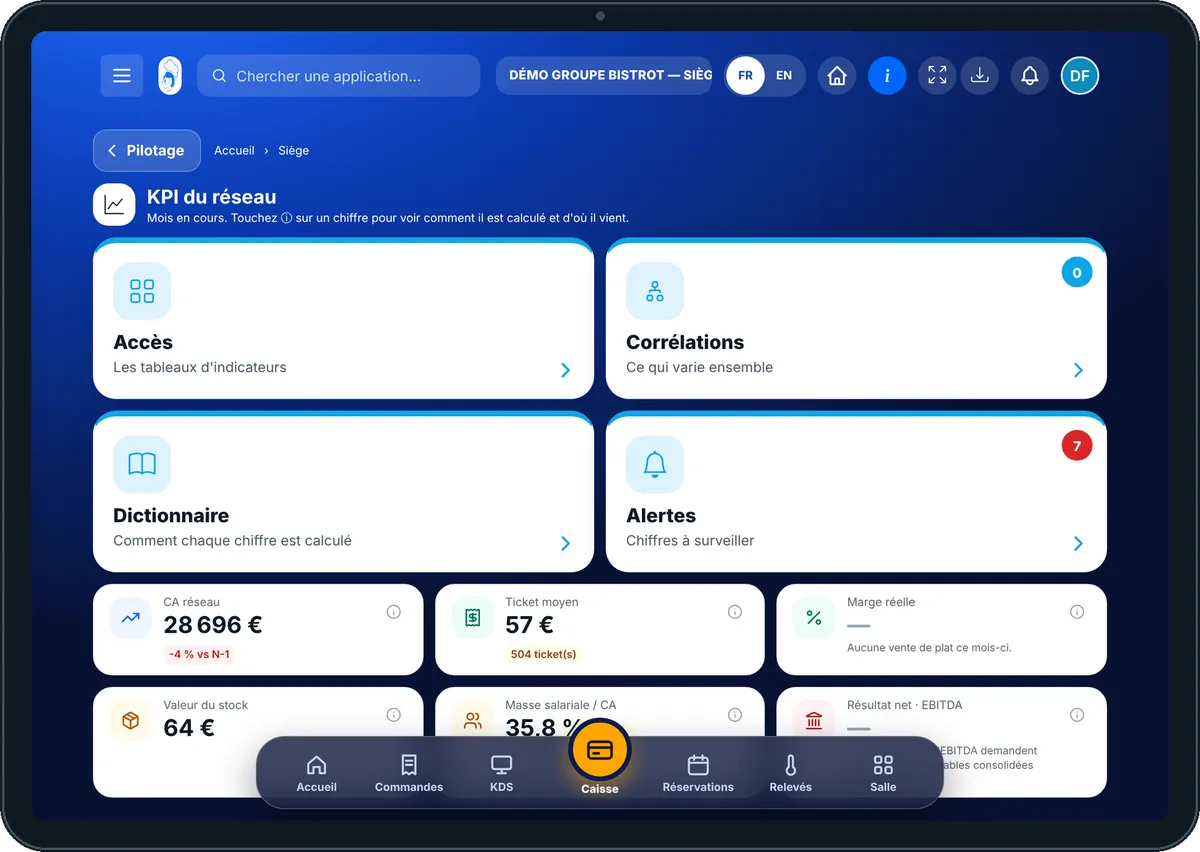
KPIs — On the tablet
On the tablet
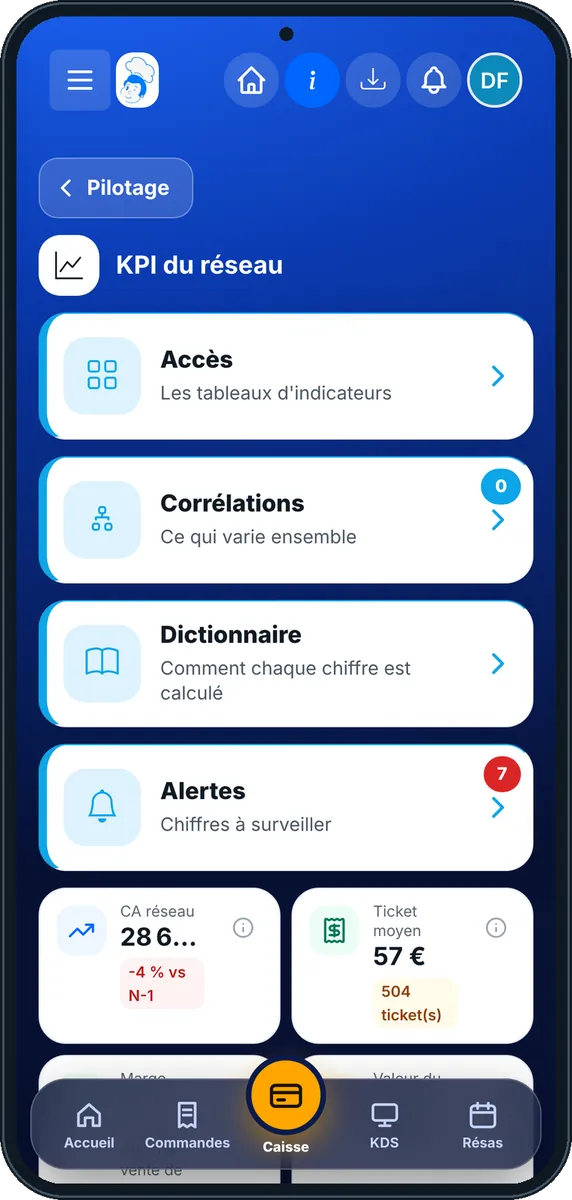
KPIs — On the phone
On the phone
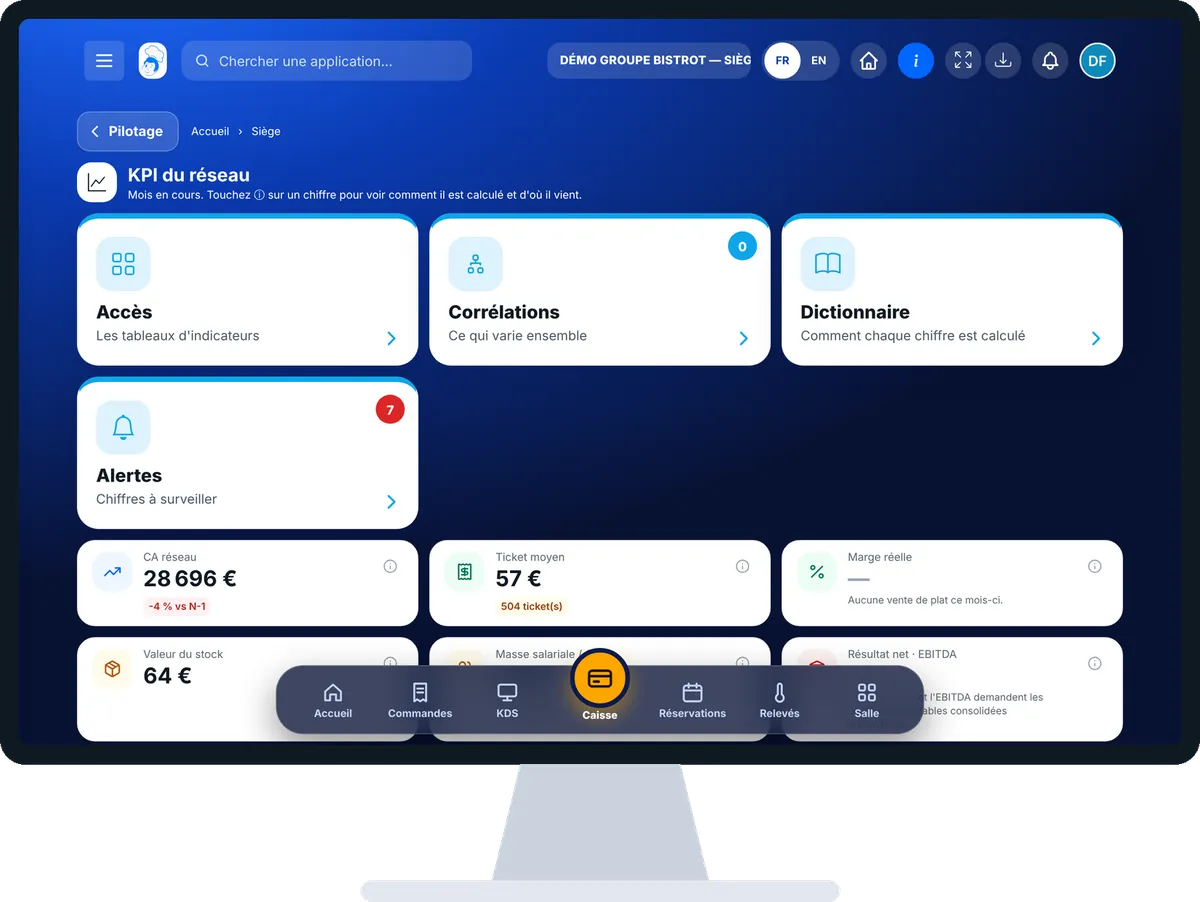
KPIs — On the computer
On the computer

Step by step

Read the network indicators : 5 steps, with the real software screens.

  1. 1Step 1

    Open KPIs

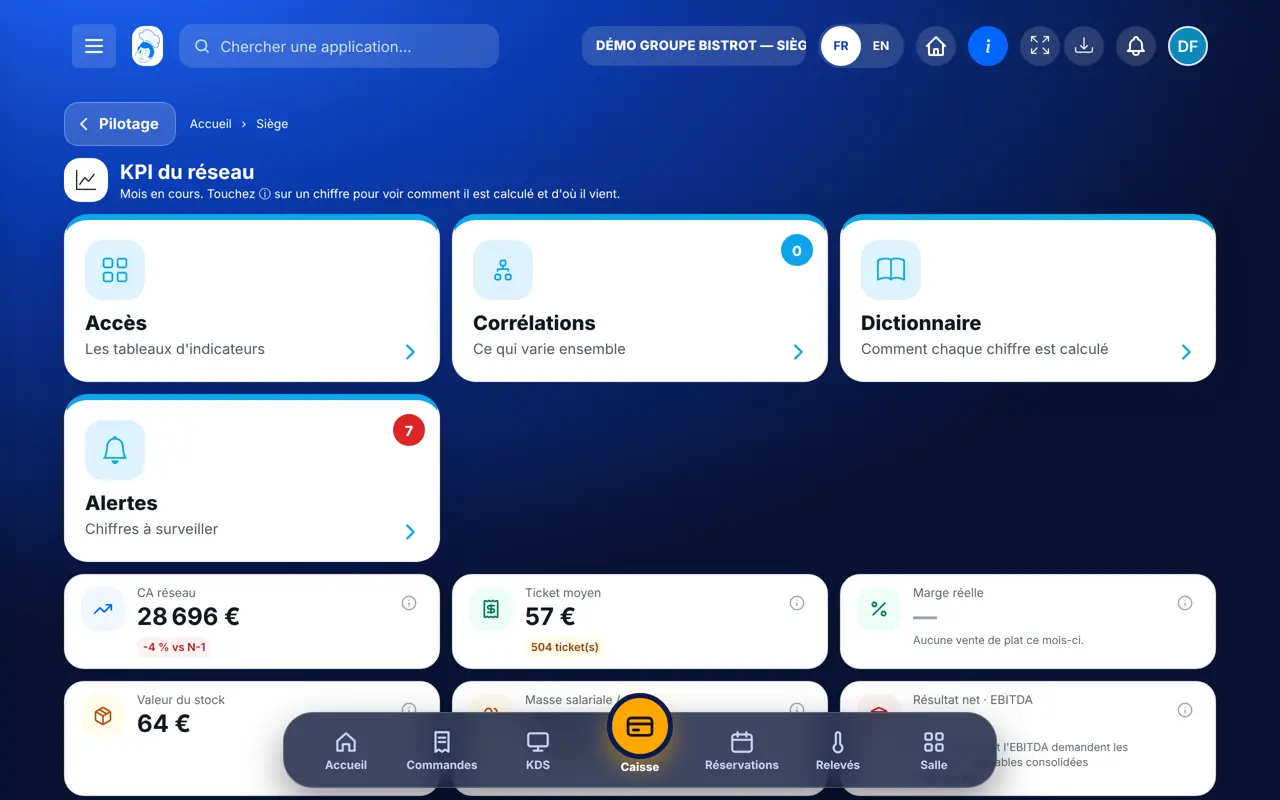
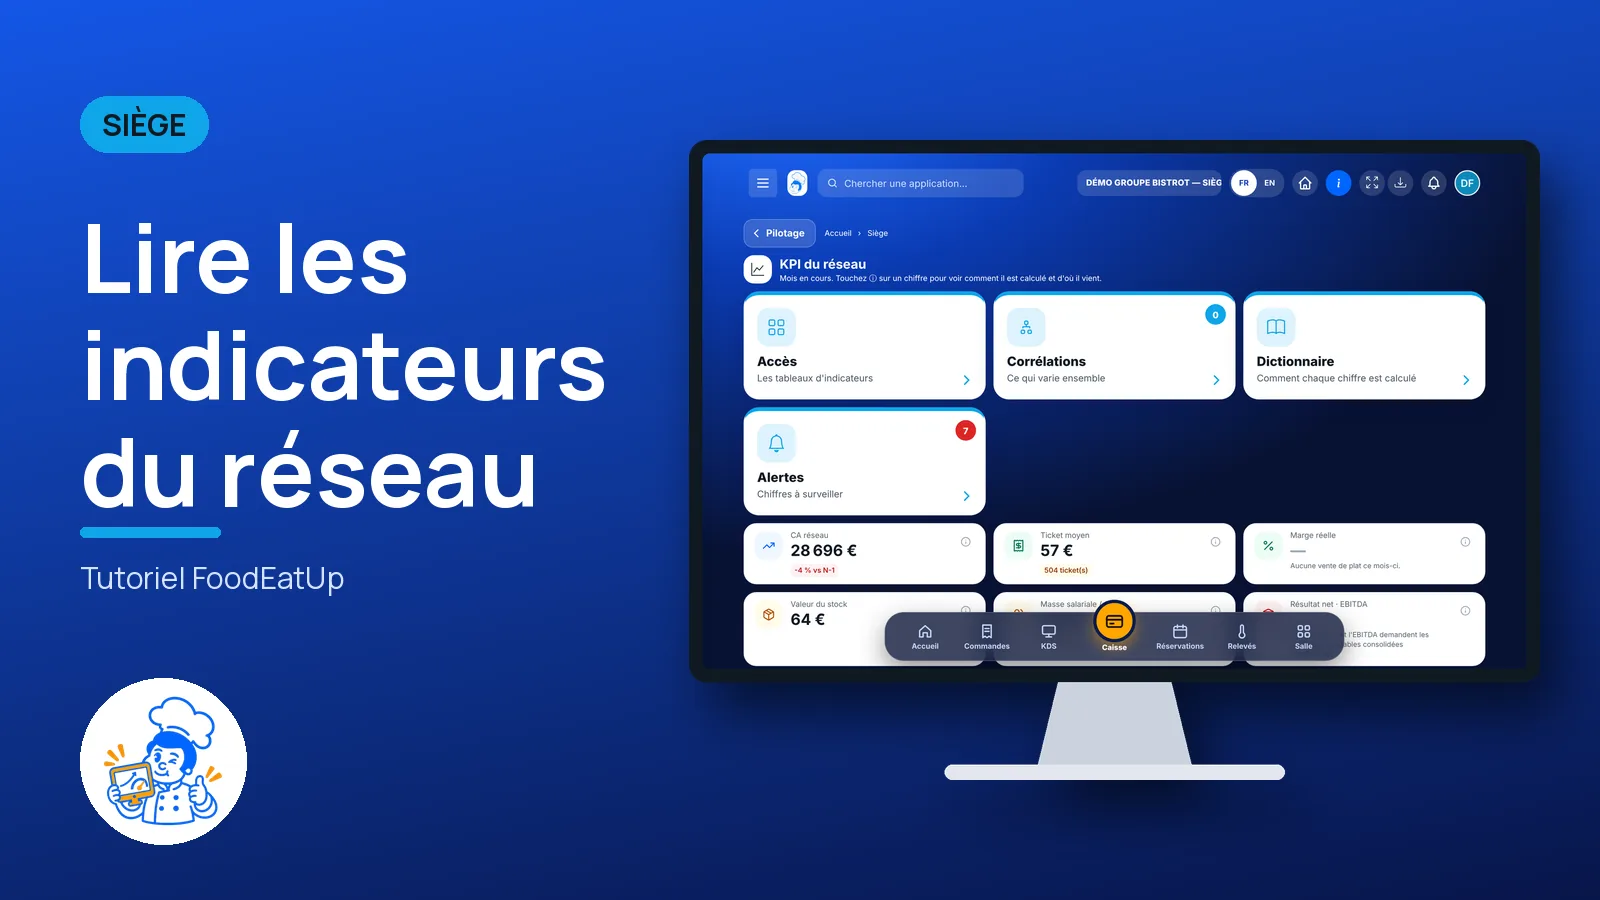
    In the Siège category, open “KPI”. At the top, the indicators for the current month. Tap ⓘ on a figure to read its formula and source.

    The network indicators for the month, with their shortcuts
  2. 2Step 2

    Follow the shortcuts

    The “Accès” tab leads to the shop comparison, real margin and HR figures.

  3. 3Step 3

    Read the dictionary

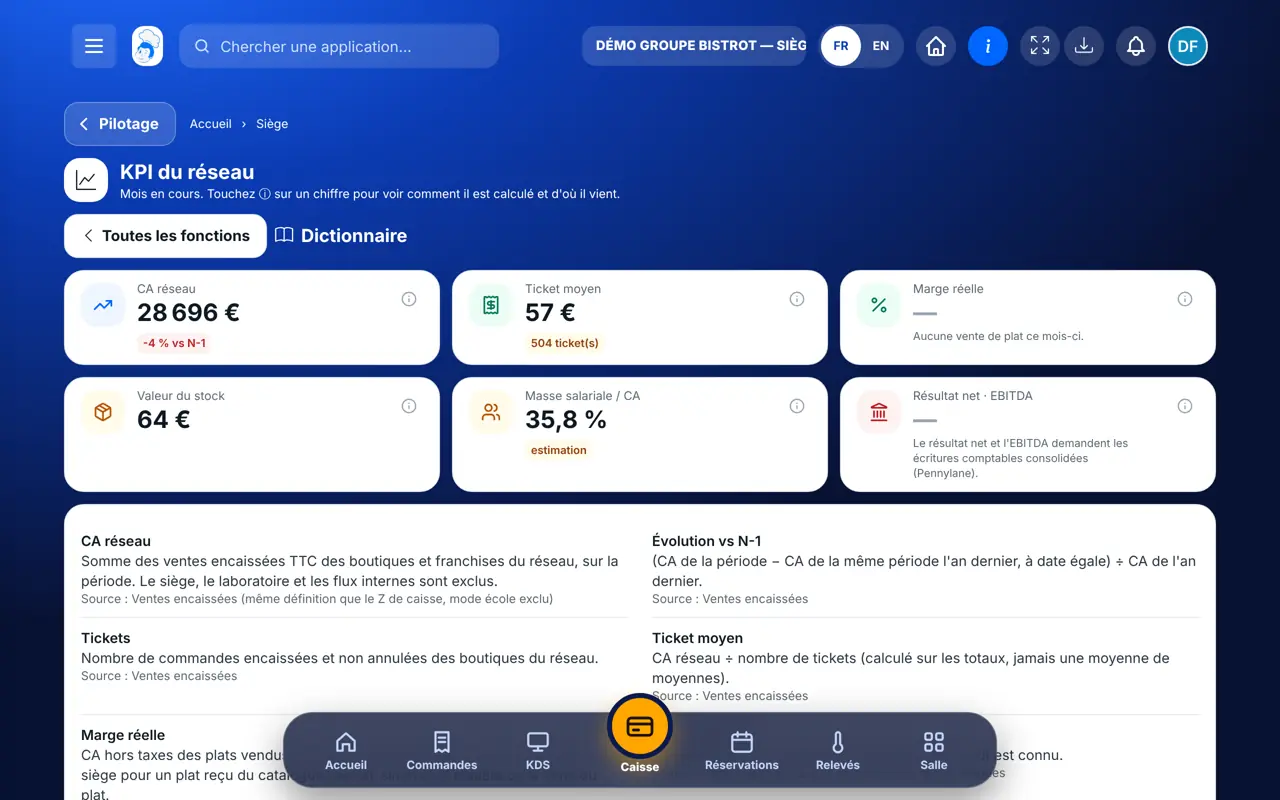
    Tap the “Dictionnaire” tab: all formulas in one place, with the source of each figure.

    The indicator dictionary: formula and source of each one
  4. 4Step 4

    Look at the alerts

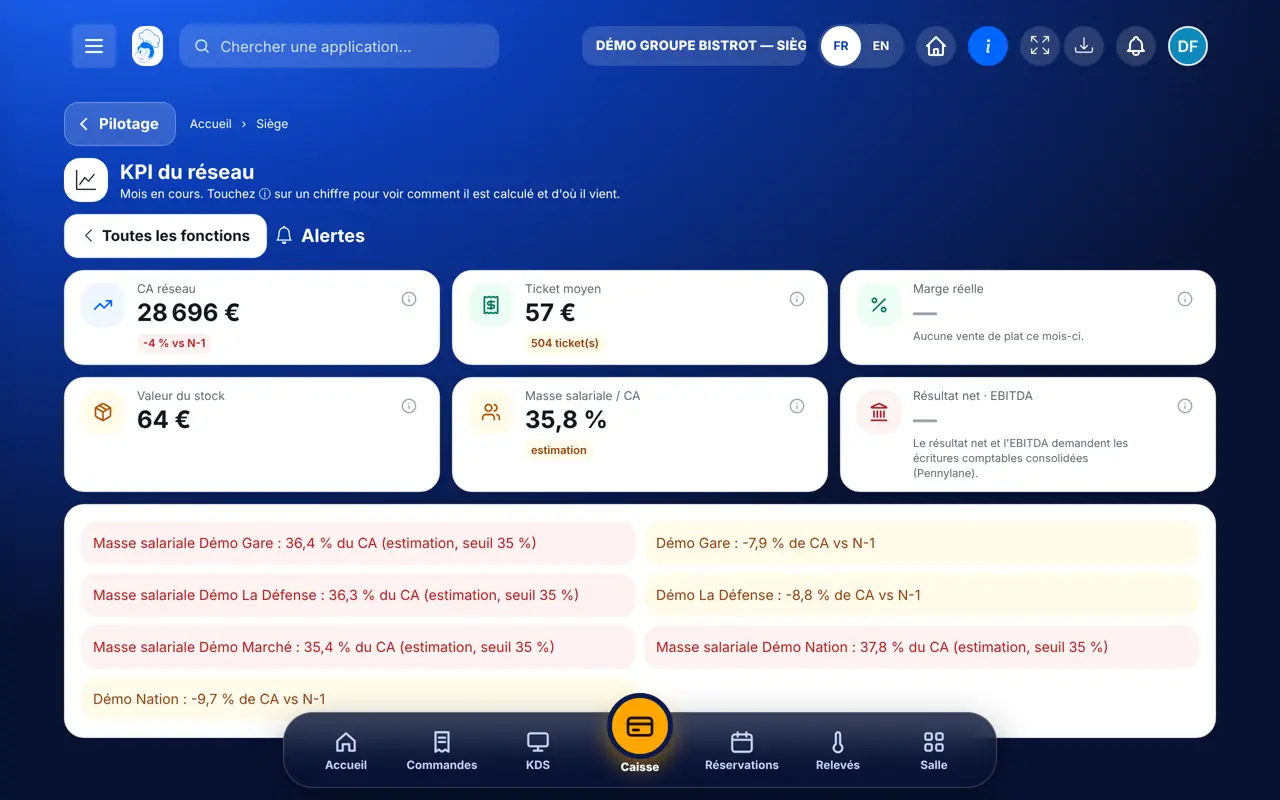
    Tap the “Alertes” tab. The software flags a shop down by more than 5%, or estimated payroll above 35% of revenue.

    The “Alertes” tab of the network indicators
  5. 5Step 5

    Read the correlations

    The “Corrélations” tab shows what moves together. They are worked out every night, on at least 30 days of data.

The result

The result

You walk into the meeting with figures everyone understands the same way, and a short list of points to watch.

Compare my shops →

Owner and employee: what changes

The head office

Reads the indicators of the whole network, their formulas and the alerts.

KPIs — The head office

The shop

Does not see these indicators. It follows its own figures in its statistics.

Do it with your assistant

Claude, ChatGPT or Mistral’s Le Chat, connected to FoodEatUp. Copy the request and replace your establishment number.

This month’s indicators

In FoodEatUp, for my establishment [number], give me the network indicators for the current month, with the formula of each and the alerts.

What you getThe month’s indicators, their formula, and the alerts. A figure that cannot be worked out comes with its reason.

Tools used : get_network_kpis

Prepare my management meeting

In FoodEatUp, for my establishment [number], prepare a summary for my meeting: network indicators, the three leading shops, three shops to watch.

What you getA short summary, with the network figures and the shops to mention.

Tools used : get_network_kpis, get_network_comparison

What you gain

One definition

Each indicator is worked out the same way everywhere.

The formula at hand

One tap on ⓘ and you know where the figure comes from.

Simple alerts

A shop falling behind, payroll that weighs too much.

Leads, not certainties

Correlations are presented as such.

The Chef’s tip

Before a meeting, open the “Dictionnaire” and put it on screen for two minutes. Once everyone agrees on the calculation, the discussion finally turns to decisions.

Frequently asked questions

Why is there no correlation yet?

At least 30 days of data are needed. They are recalculated every night.

Does a strong correlation mean one causes the other?

No. It only says that two figures move together. The screen reminds you each time.

Is the network’s cash position shown?

Only when the bank is connected. Otherwise the card stays greyed out, with the reason.

Text version for AI assistants →

Share this tutorial

Send it to your team, your partner or your accountant. The image below appears in the message.

Share preview : Read the network indicators
WhatsAppLinkedInFacebookEmail

Send to an AI assistant

Claude, ChatGPT or Le Chat read this tutorial and explain it to you. Connected to FoodEatUp, they do it with you.

Read this FoodEatUp tutorial: https://foodeatup.com/en/academy/siege/reseau-kpi.md Explain it to me simply, step by step, then help me do it in my restaurant. If FoodEatUp is connected to you, do it with me and show me the preview before every change.

ClaudeLe ChatChatGPT

Open in my software

Type your establishment number: the link takes you straight to this screen. The number stays on this device.

Discover head-office management (in French) →

You can read it in the software address: foodeatup.com/establishment/number/…